April 1, 2025
🌟 New Features
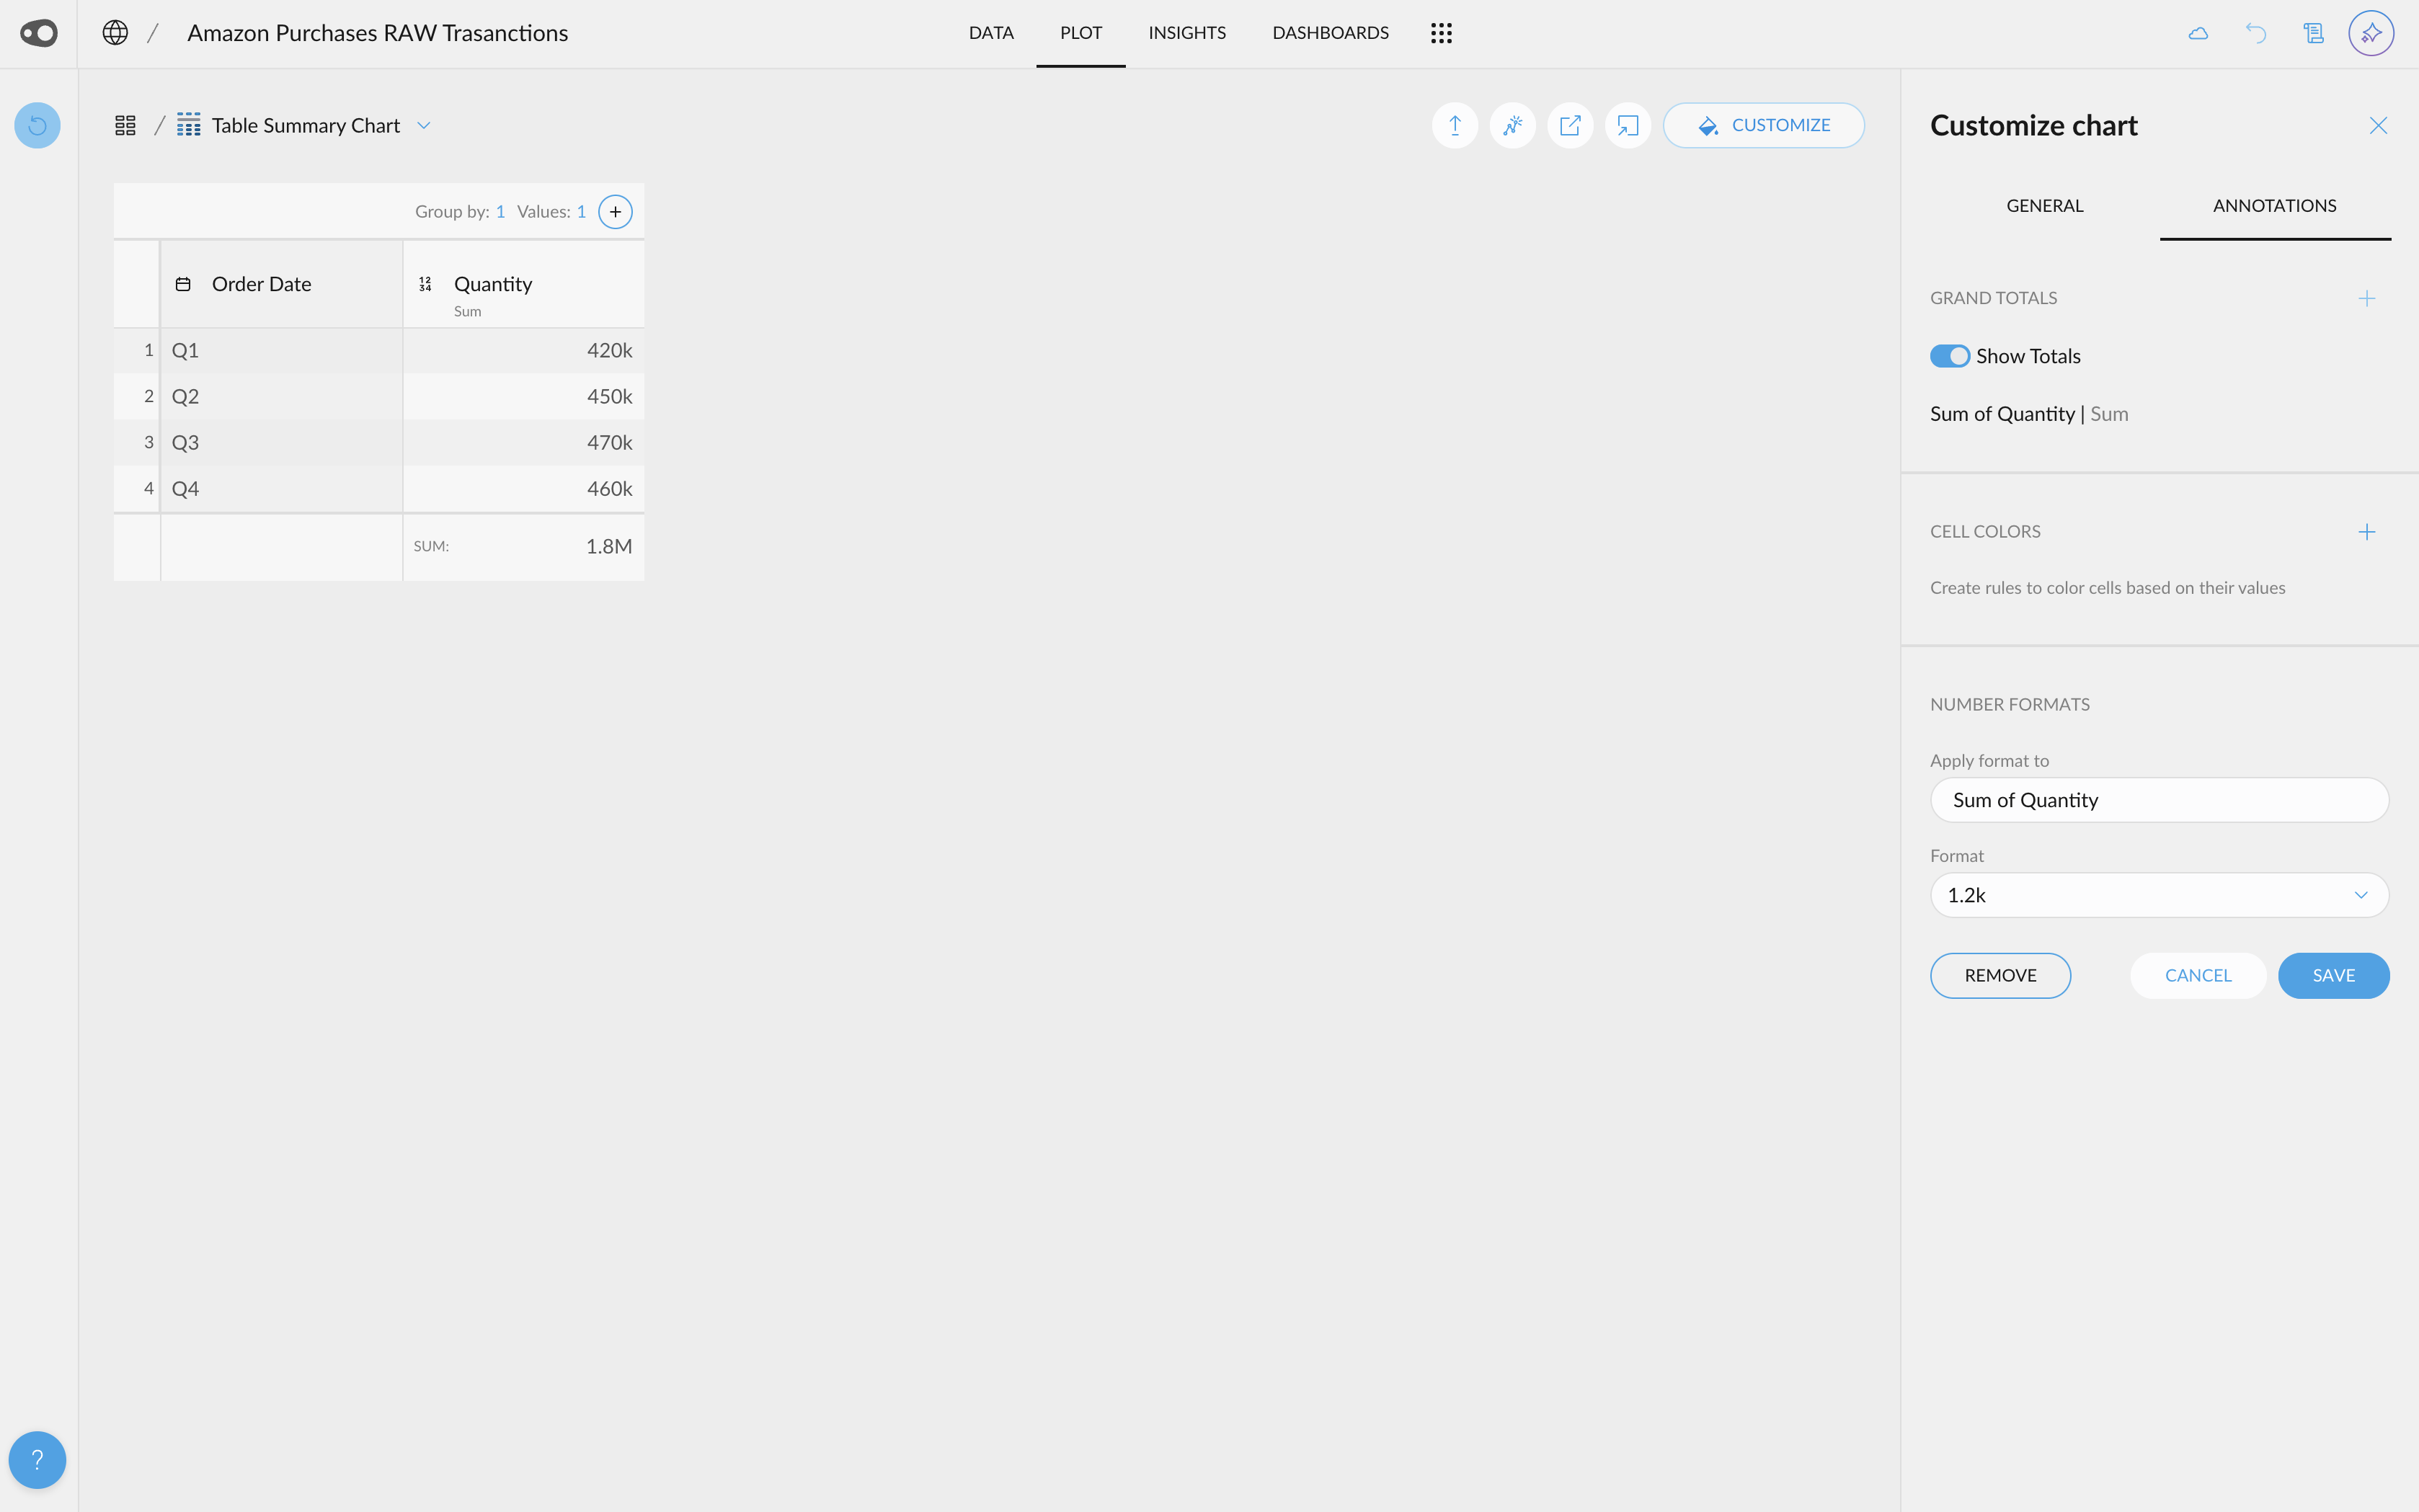
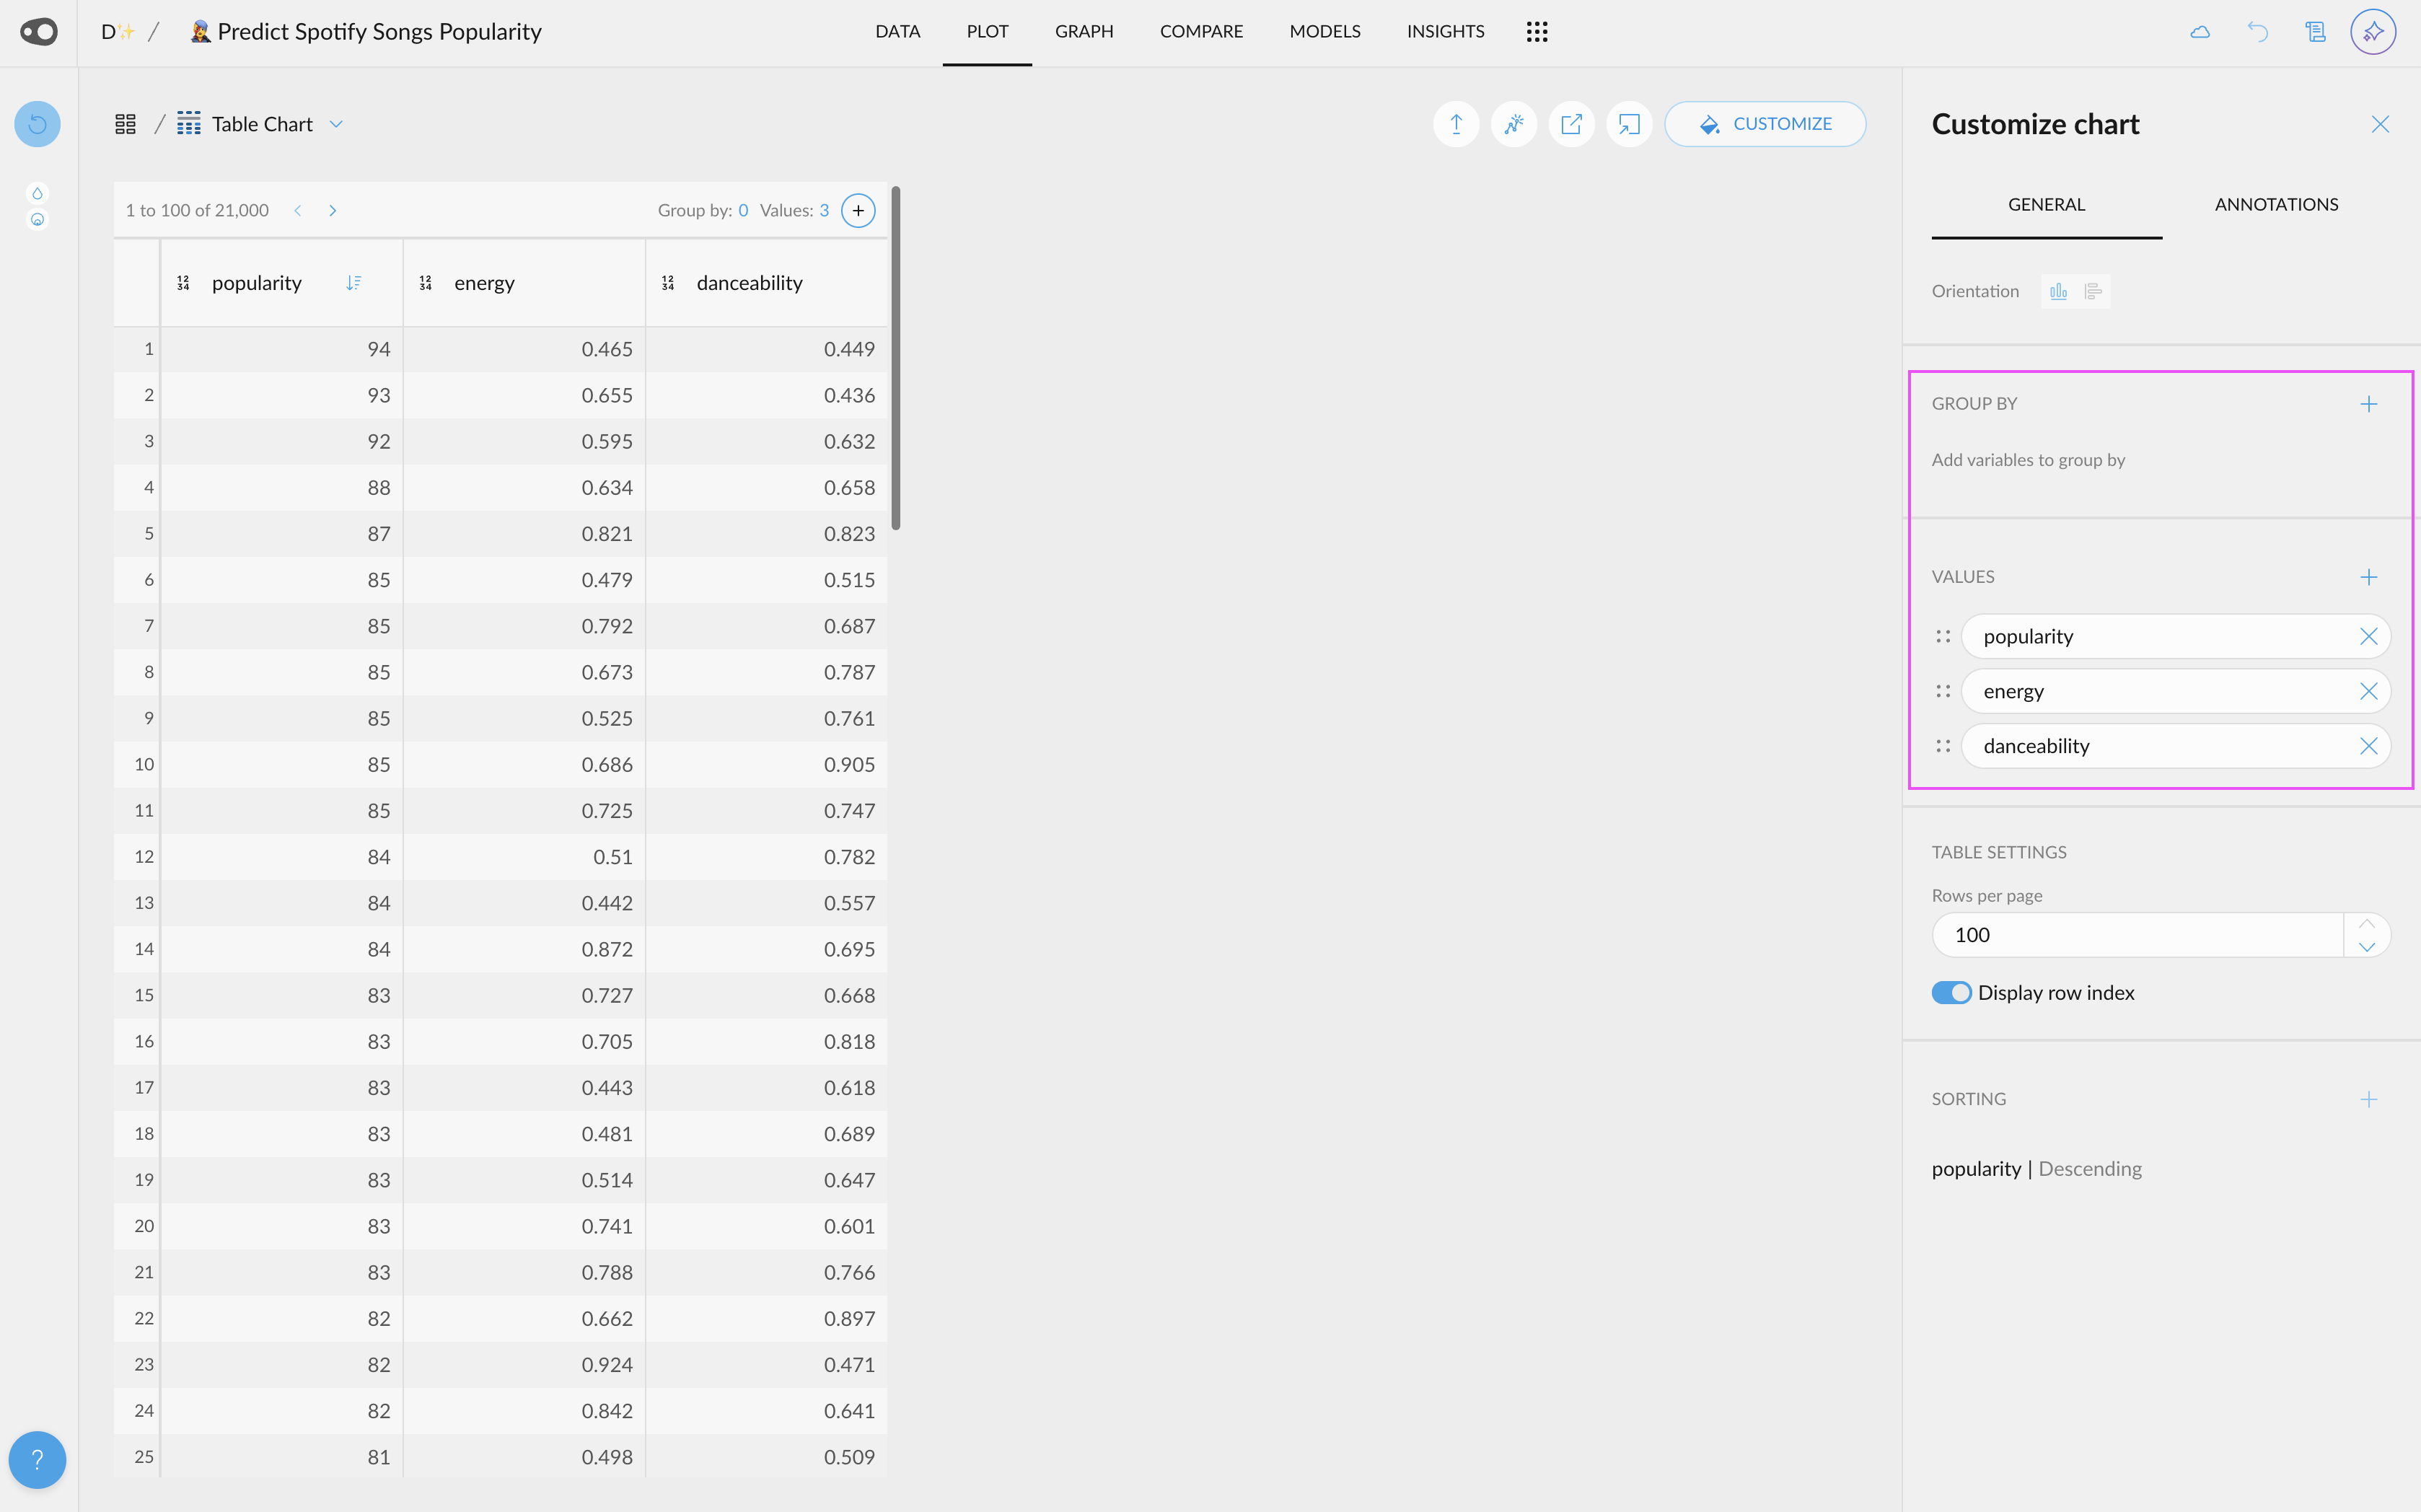
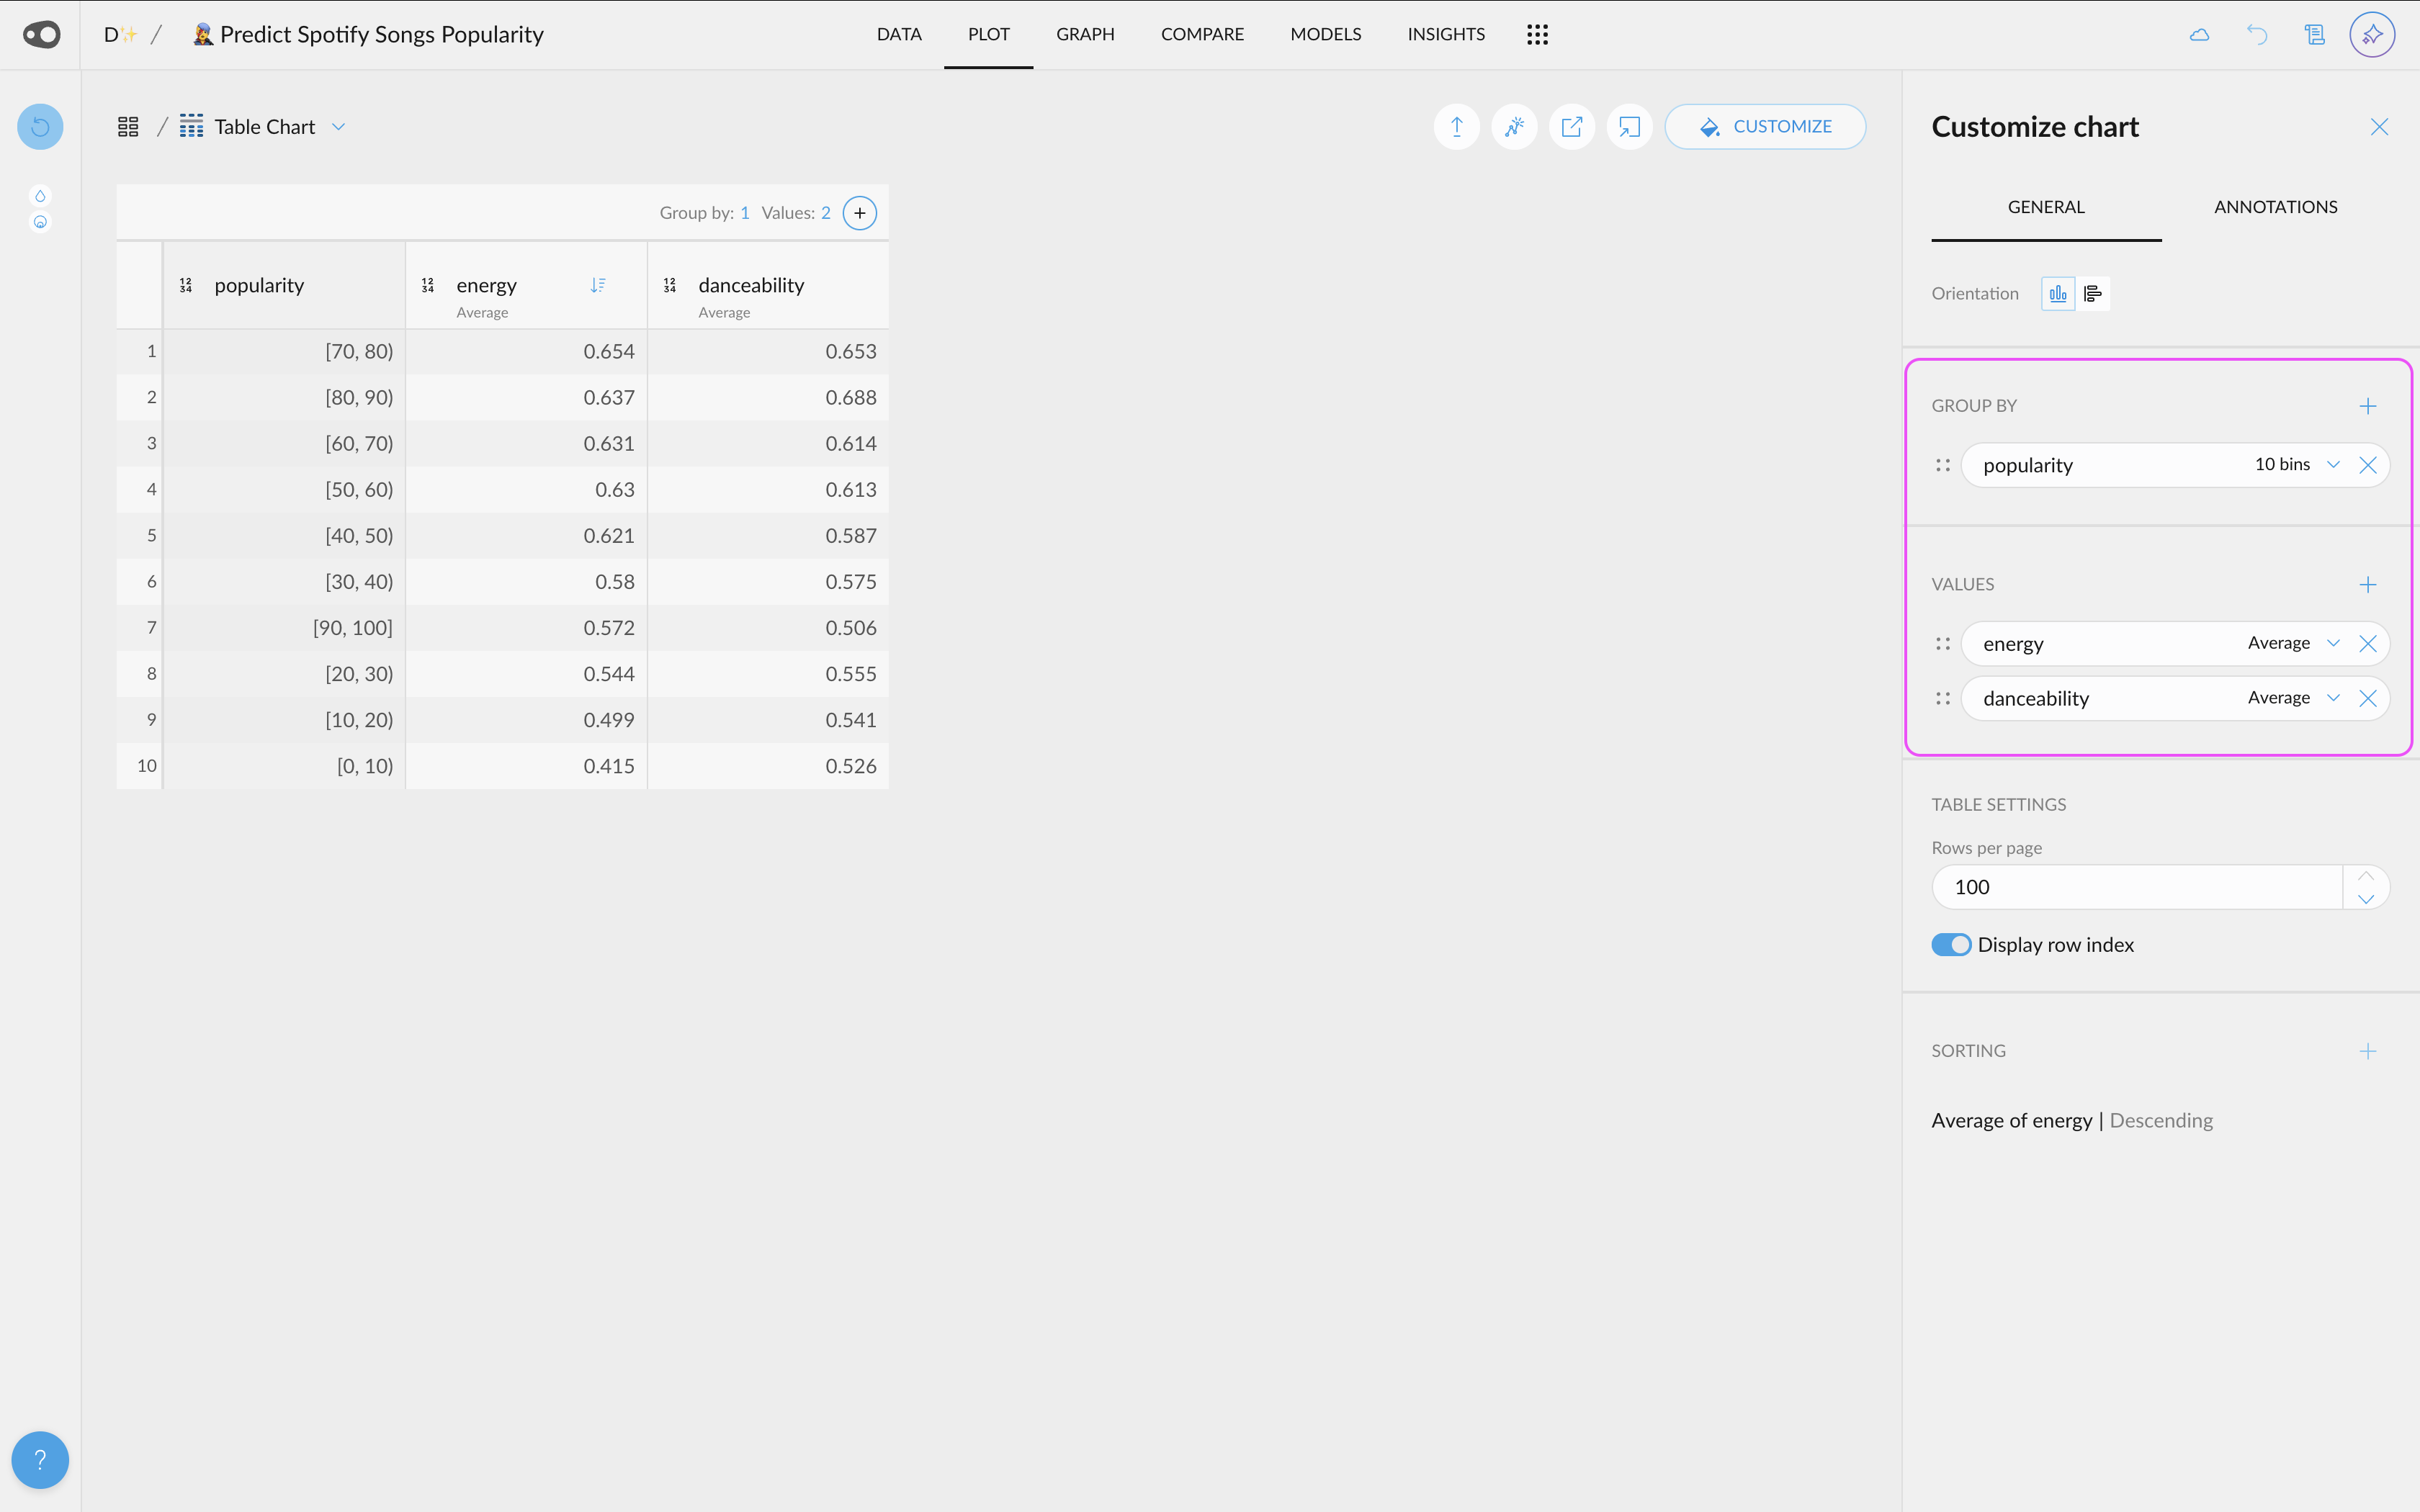
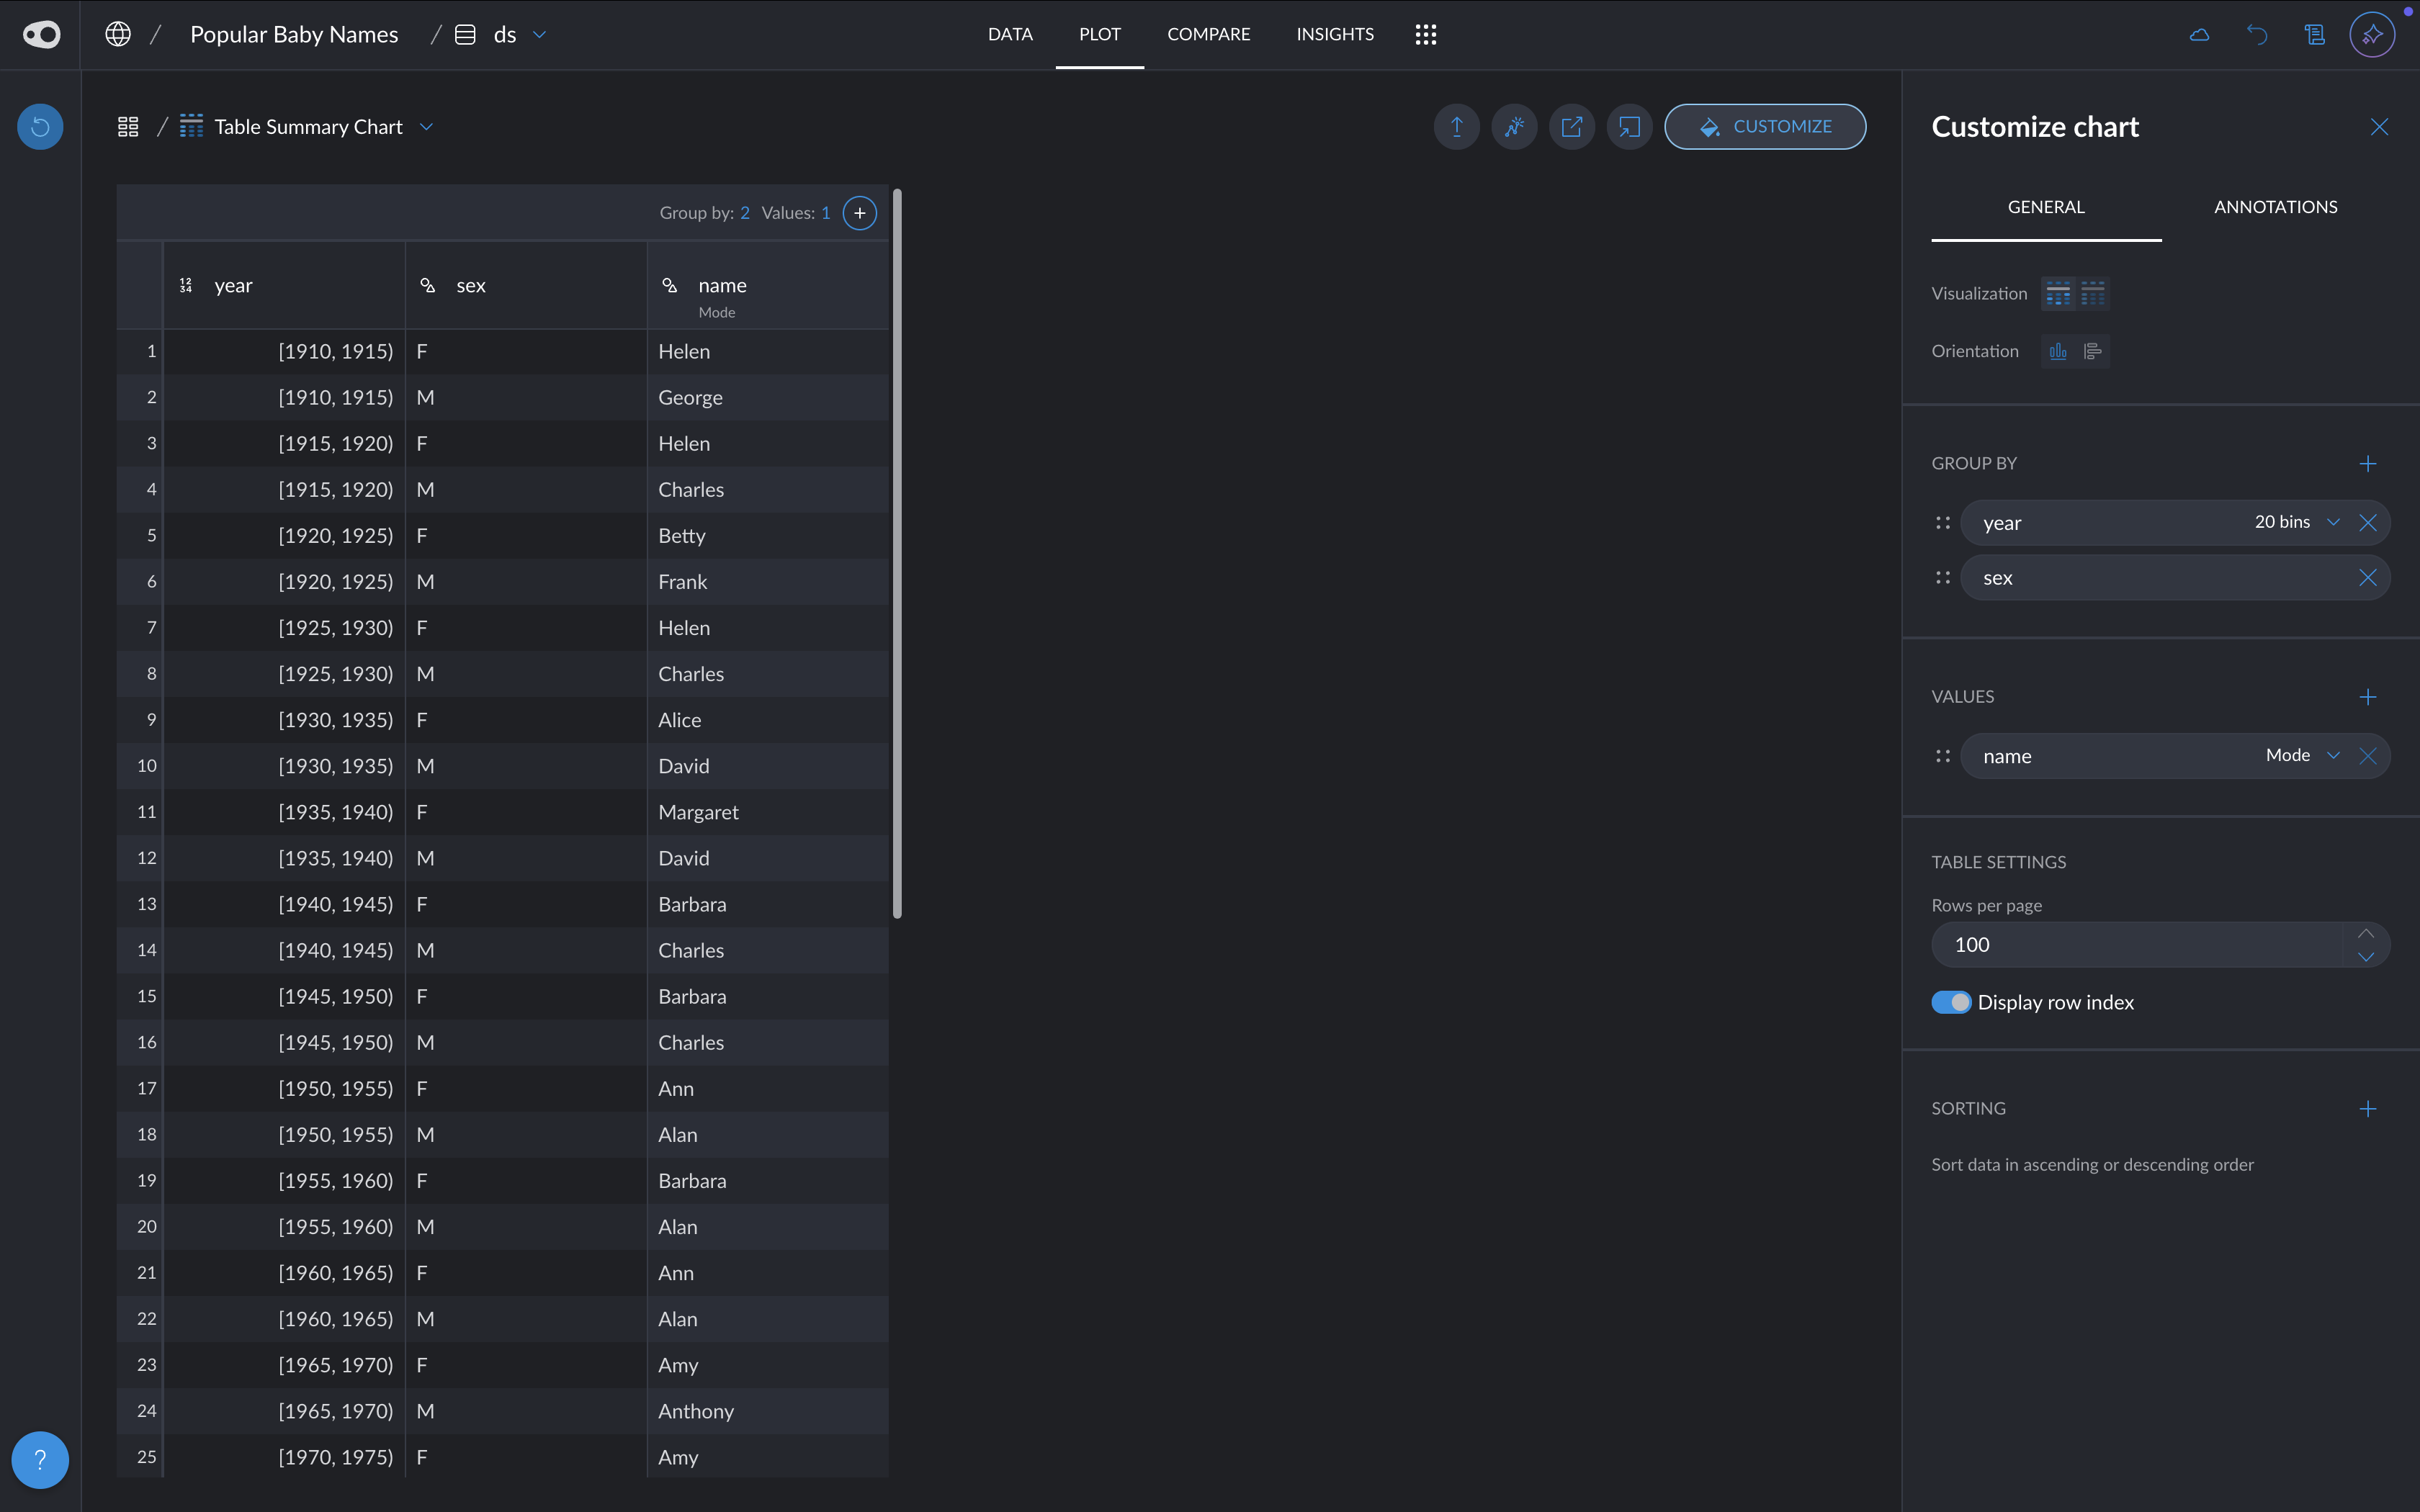
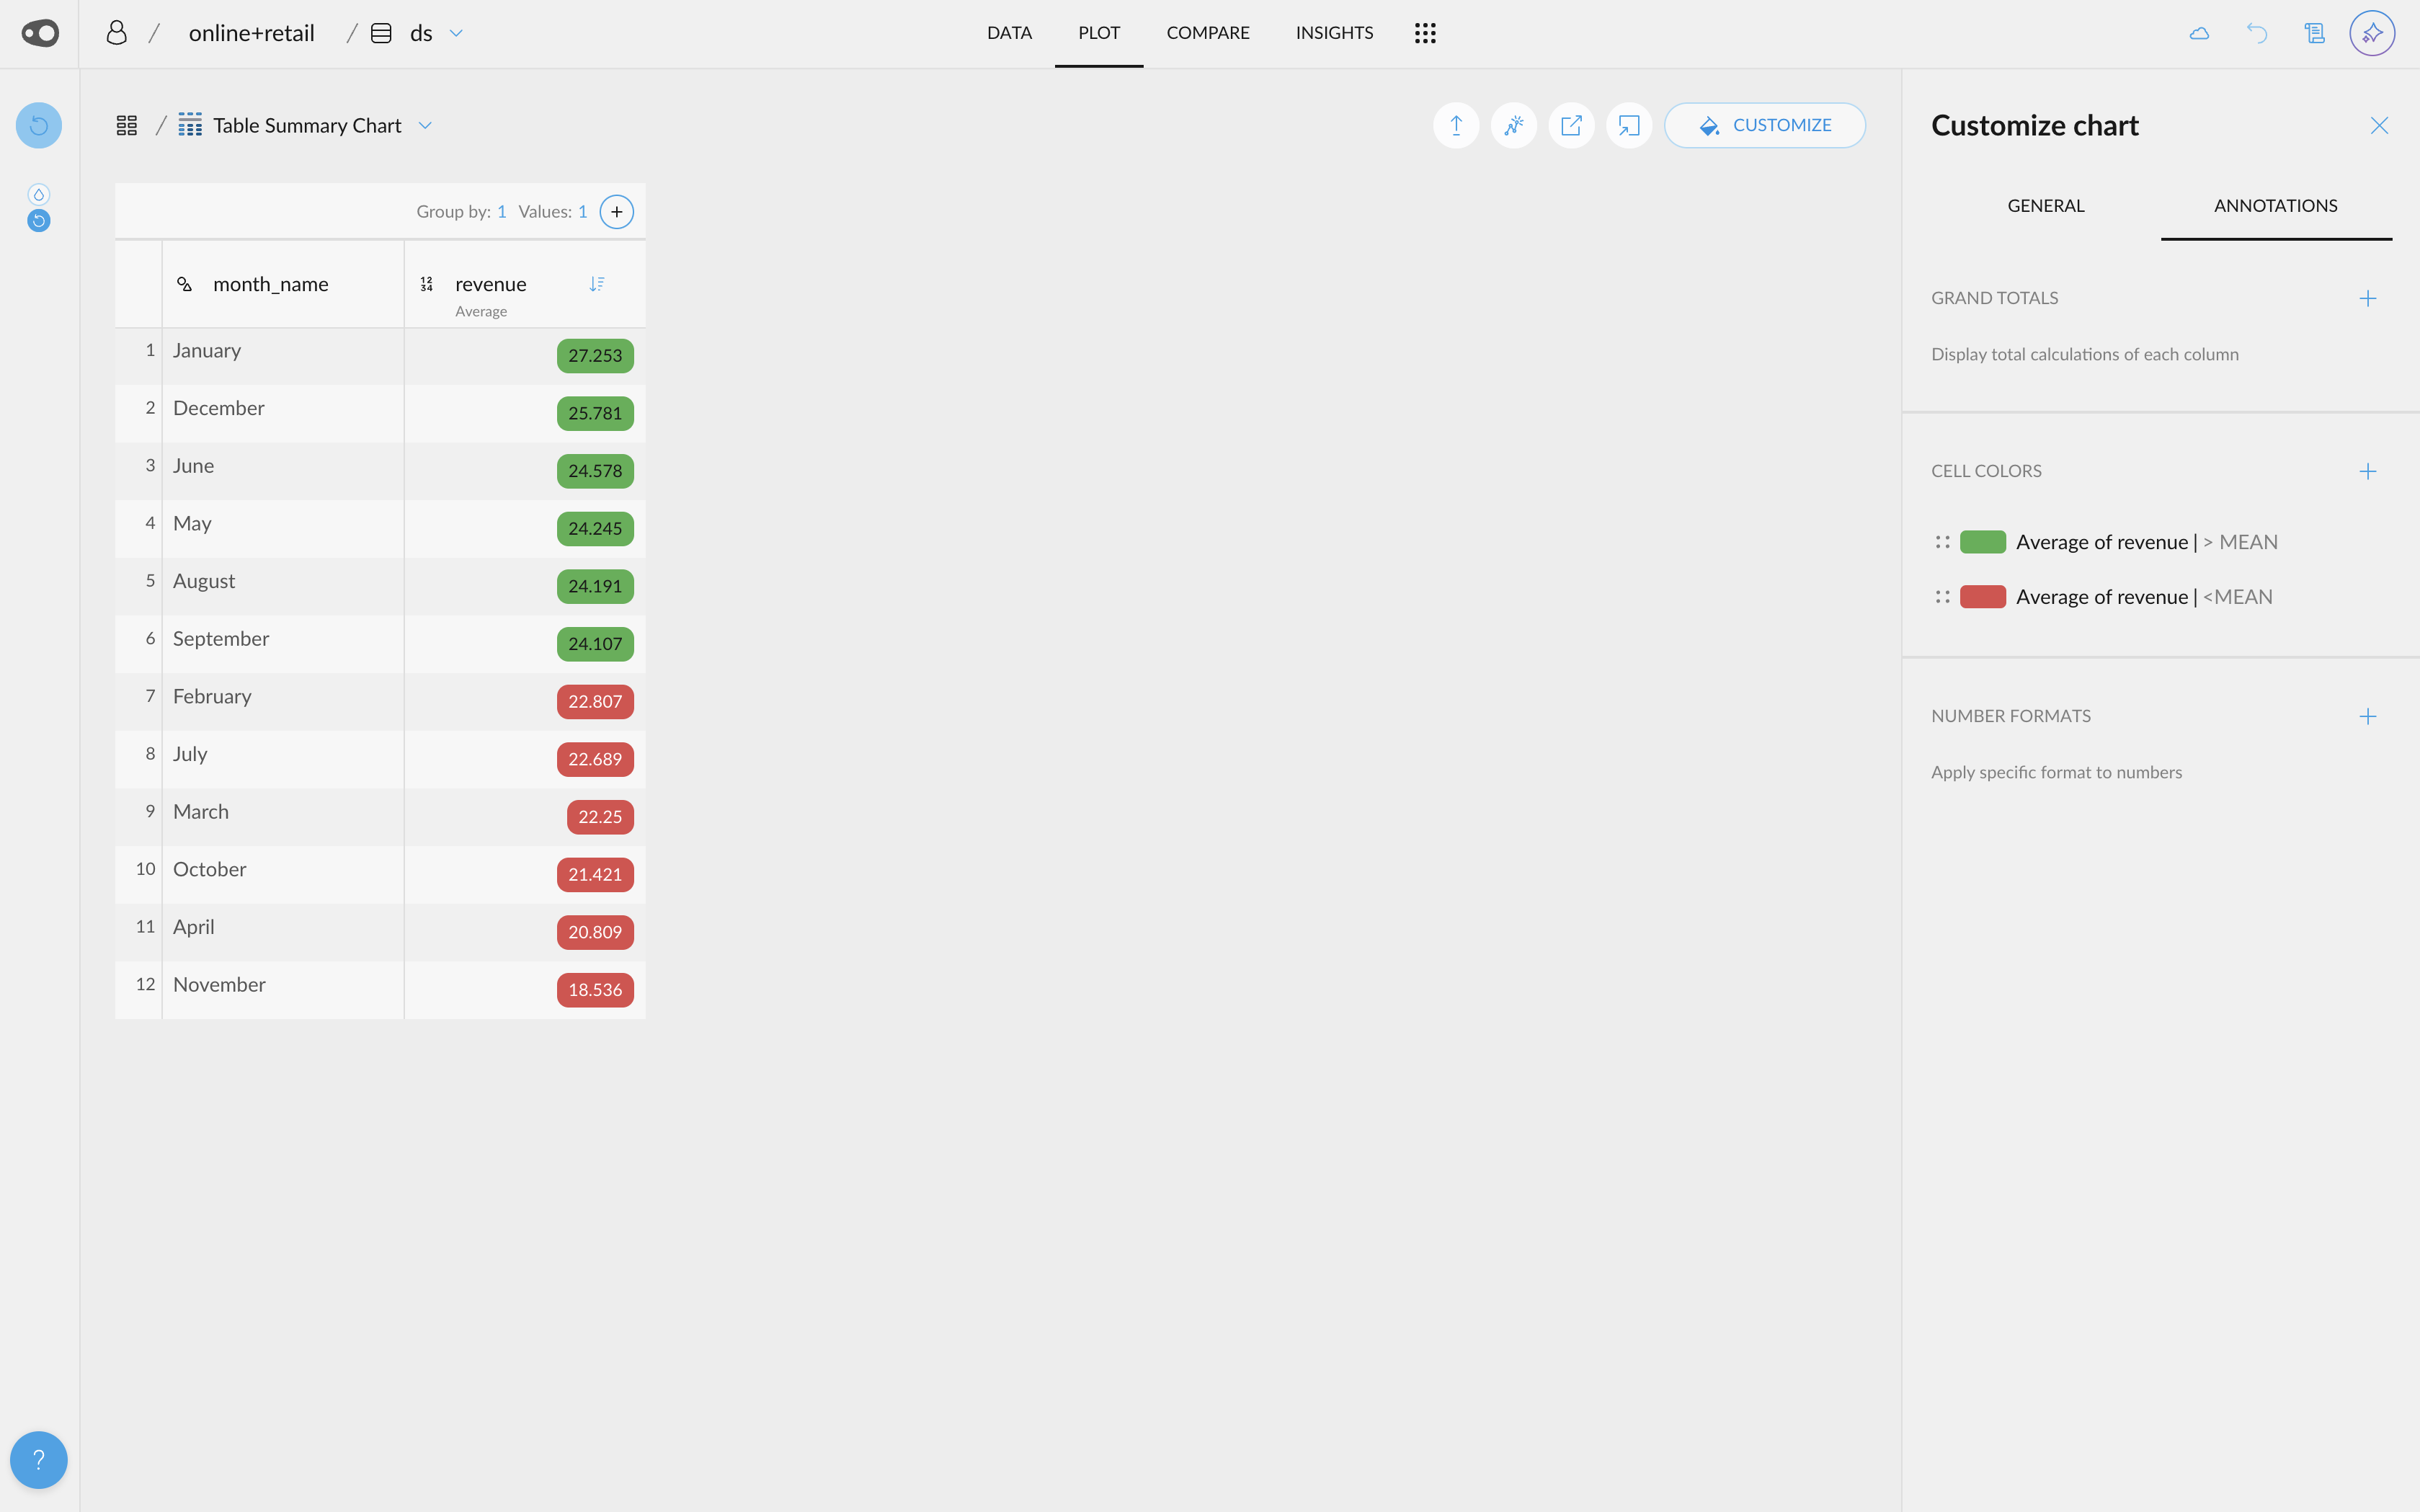
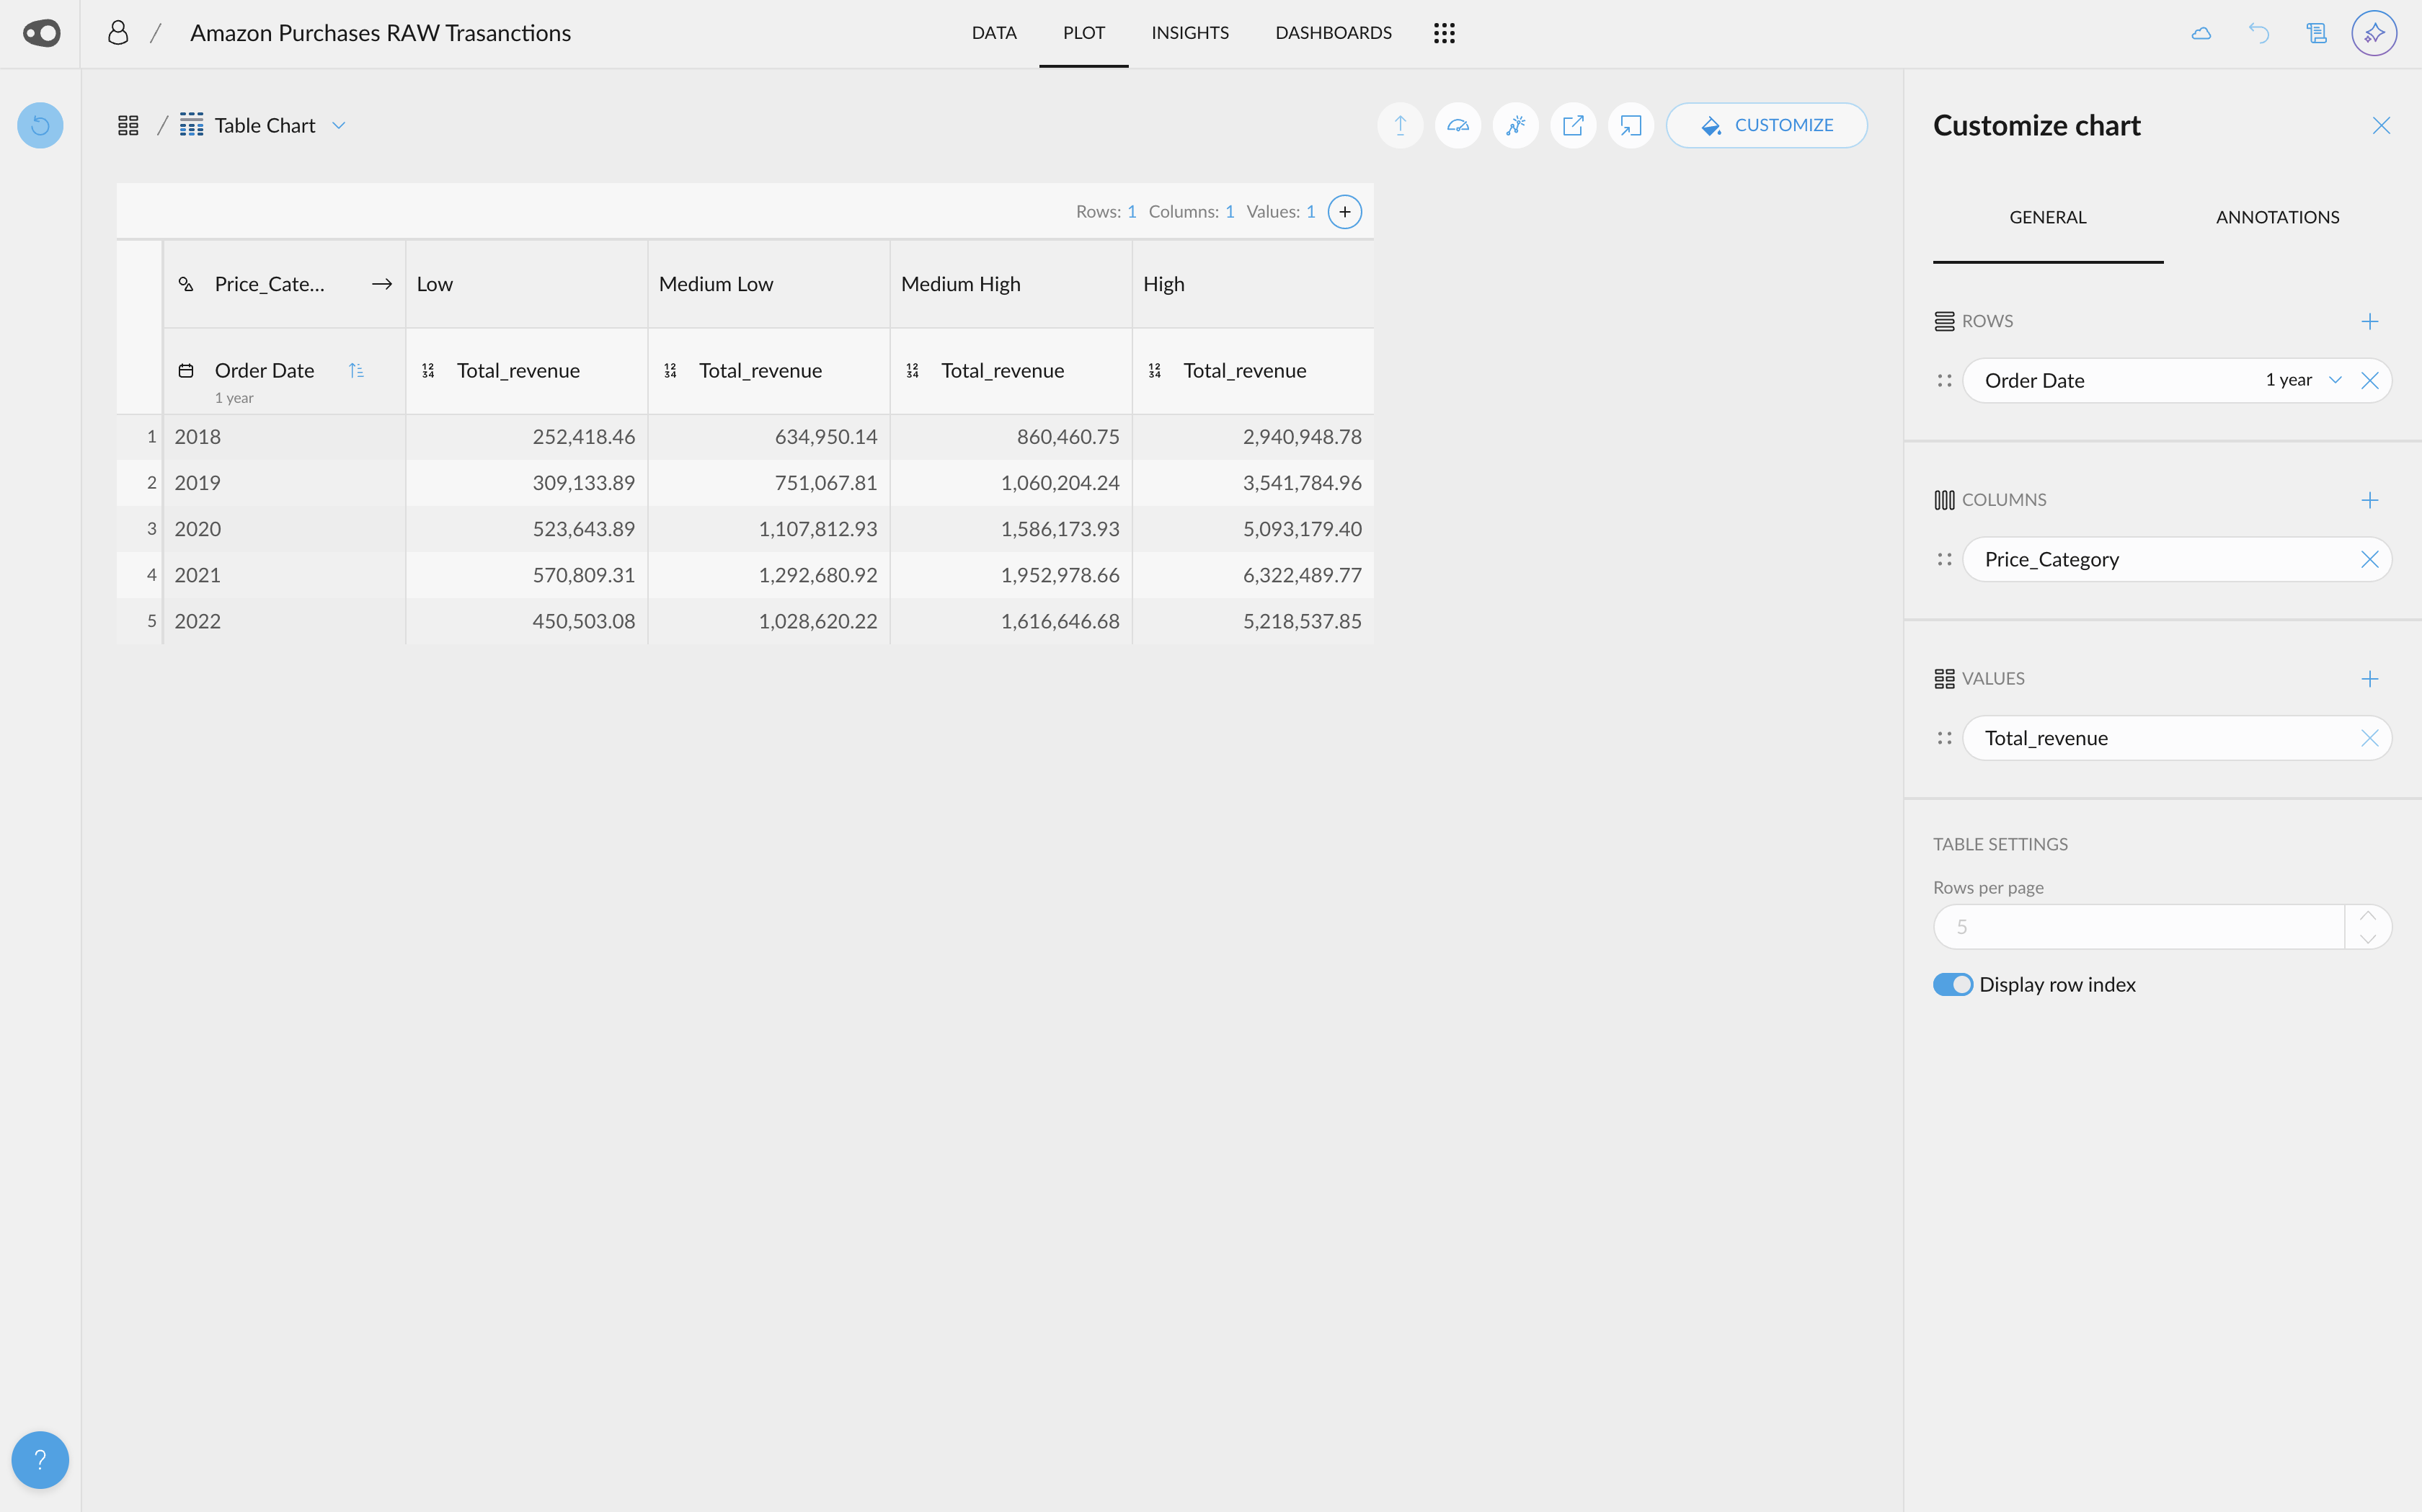
- Pivot Table. You can now choose from three variable types when using the Table Chart in Plot: Values, Rows, and Columns.
- Add only Values to create a simple table.
- Combine Rows & Values to generate the familiar summary table.
- Fill in all three slots—Rows, Columns & Values—to create a full pivot table.
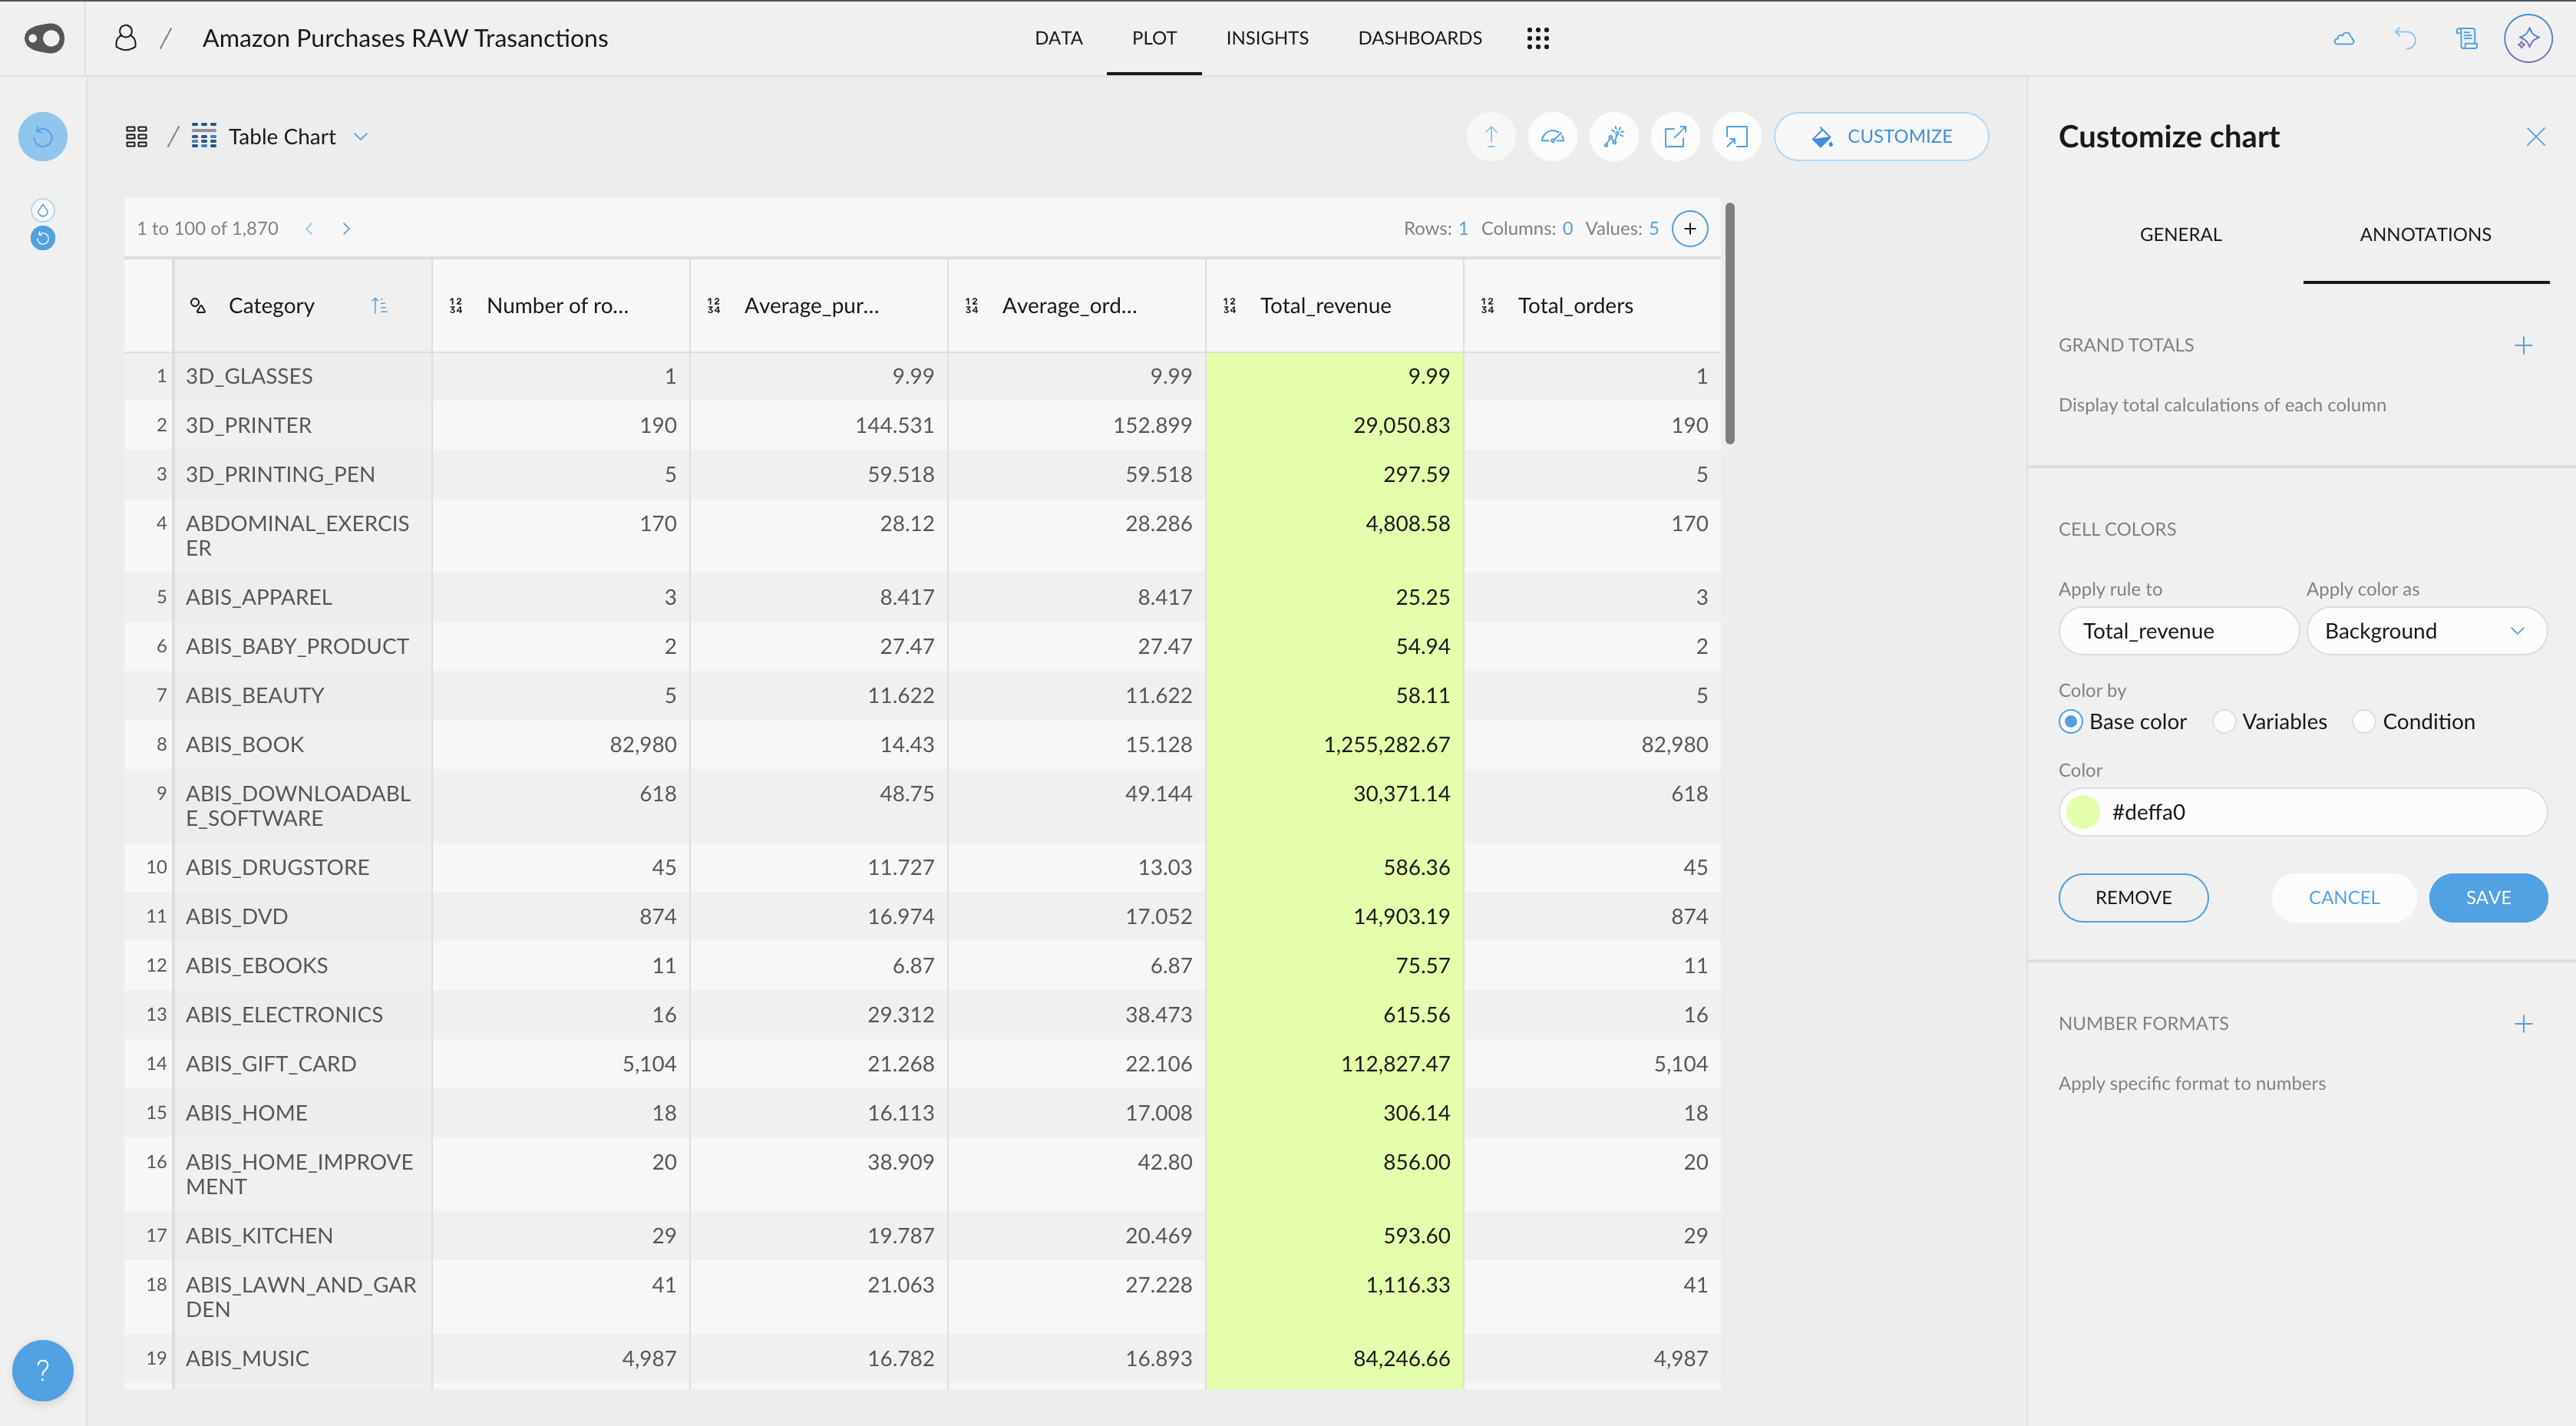
- Column Coloring. You can now apply color to an entire column in Table Chart without the need to set up a rule. This makes it easier and faster to highlight data visually.
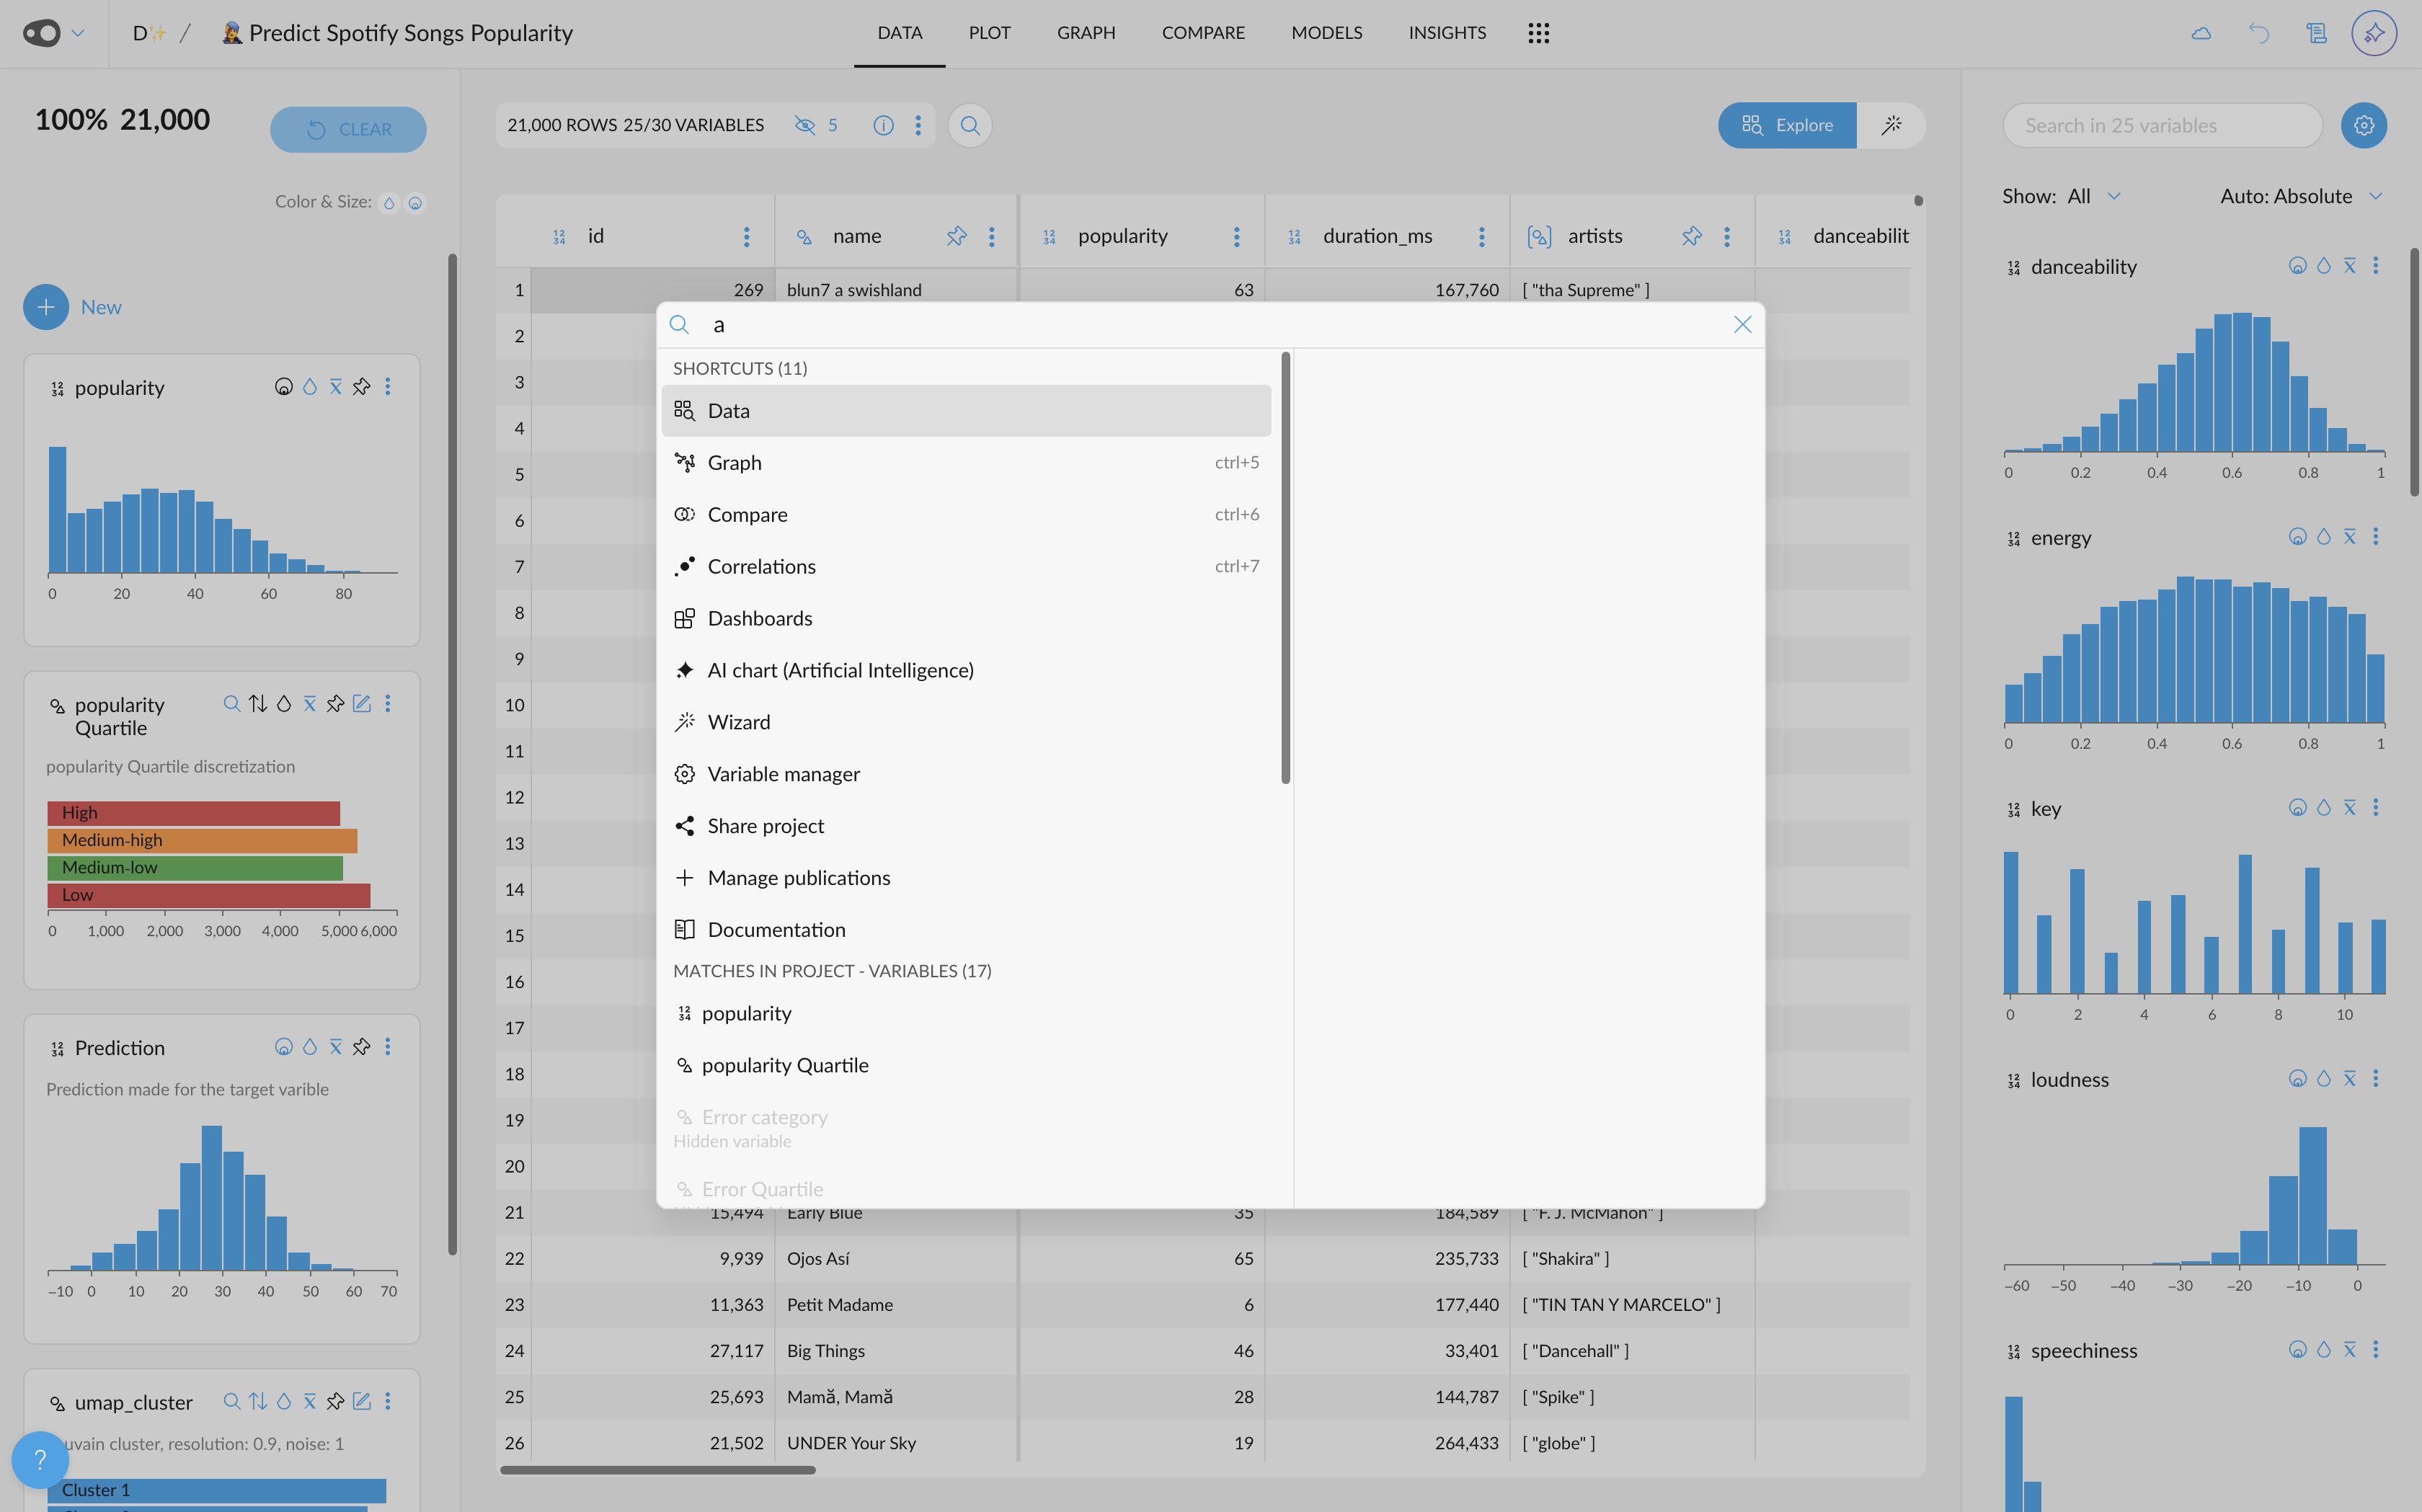
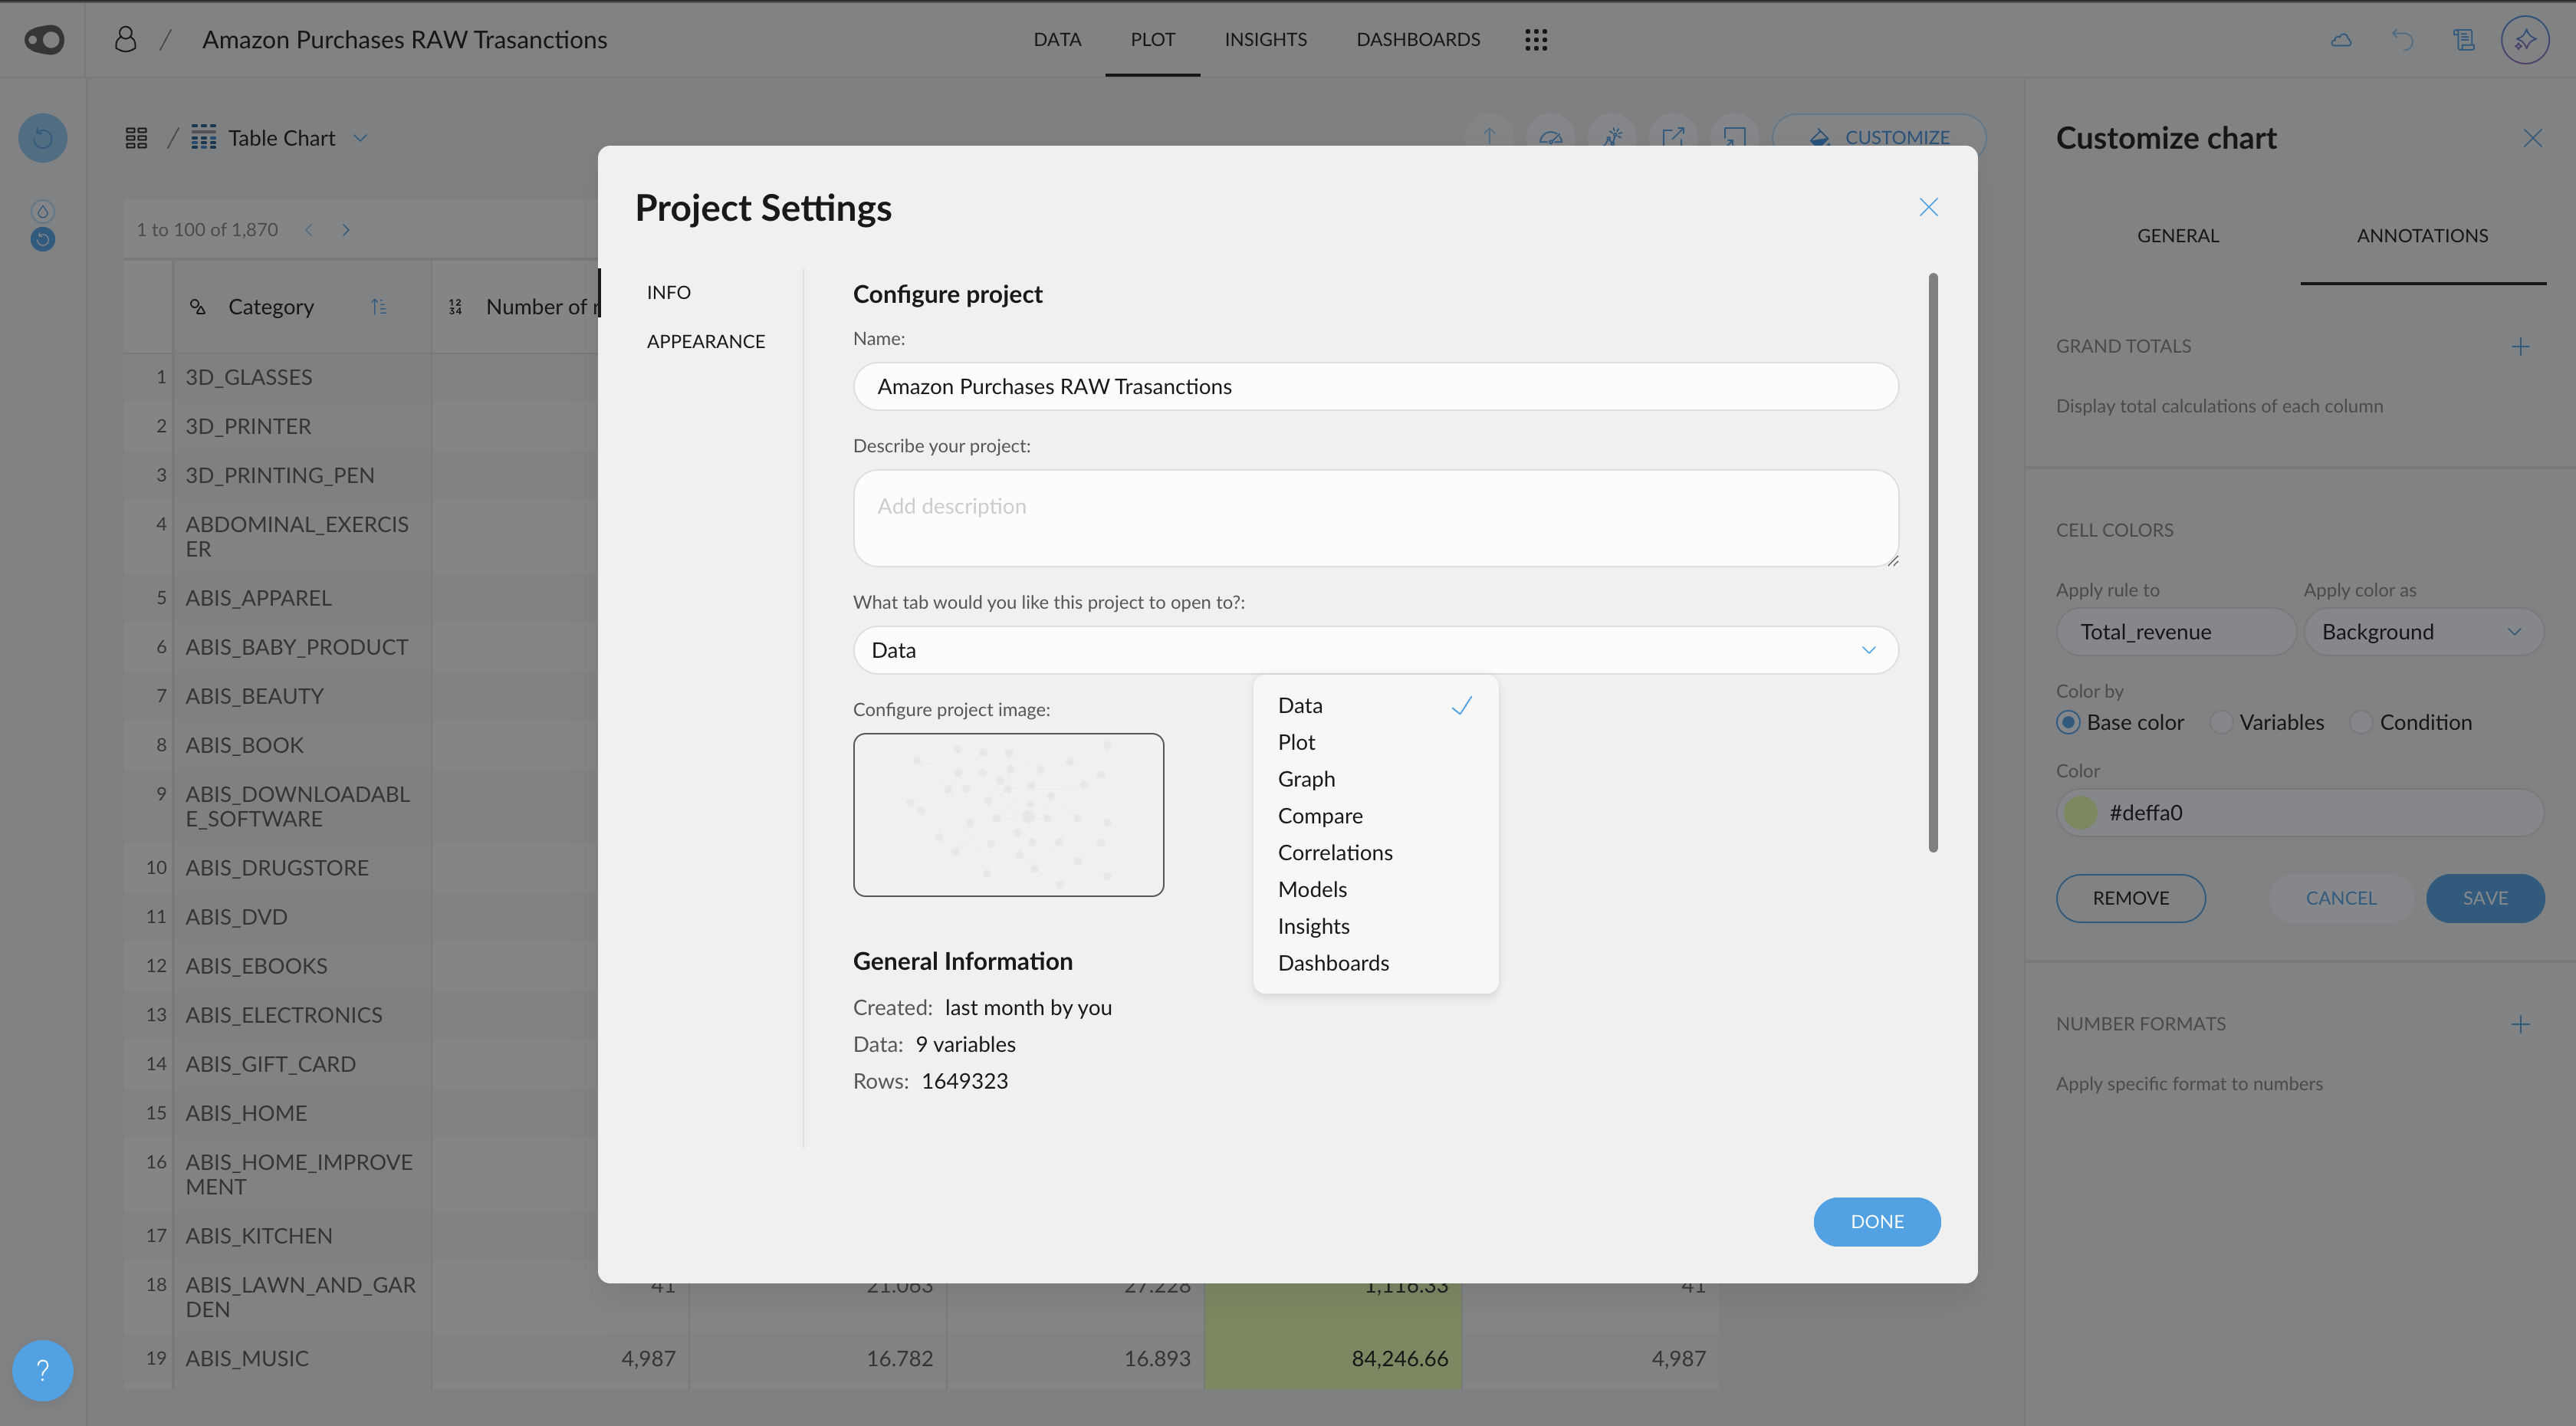
- Set Default Tab. You can now configure which tab a project opens in by default when accessed from the Hall or the Omnibar. This helps streamline your workflow and get you where you need to be faster.
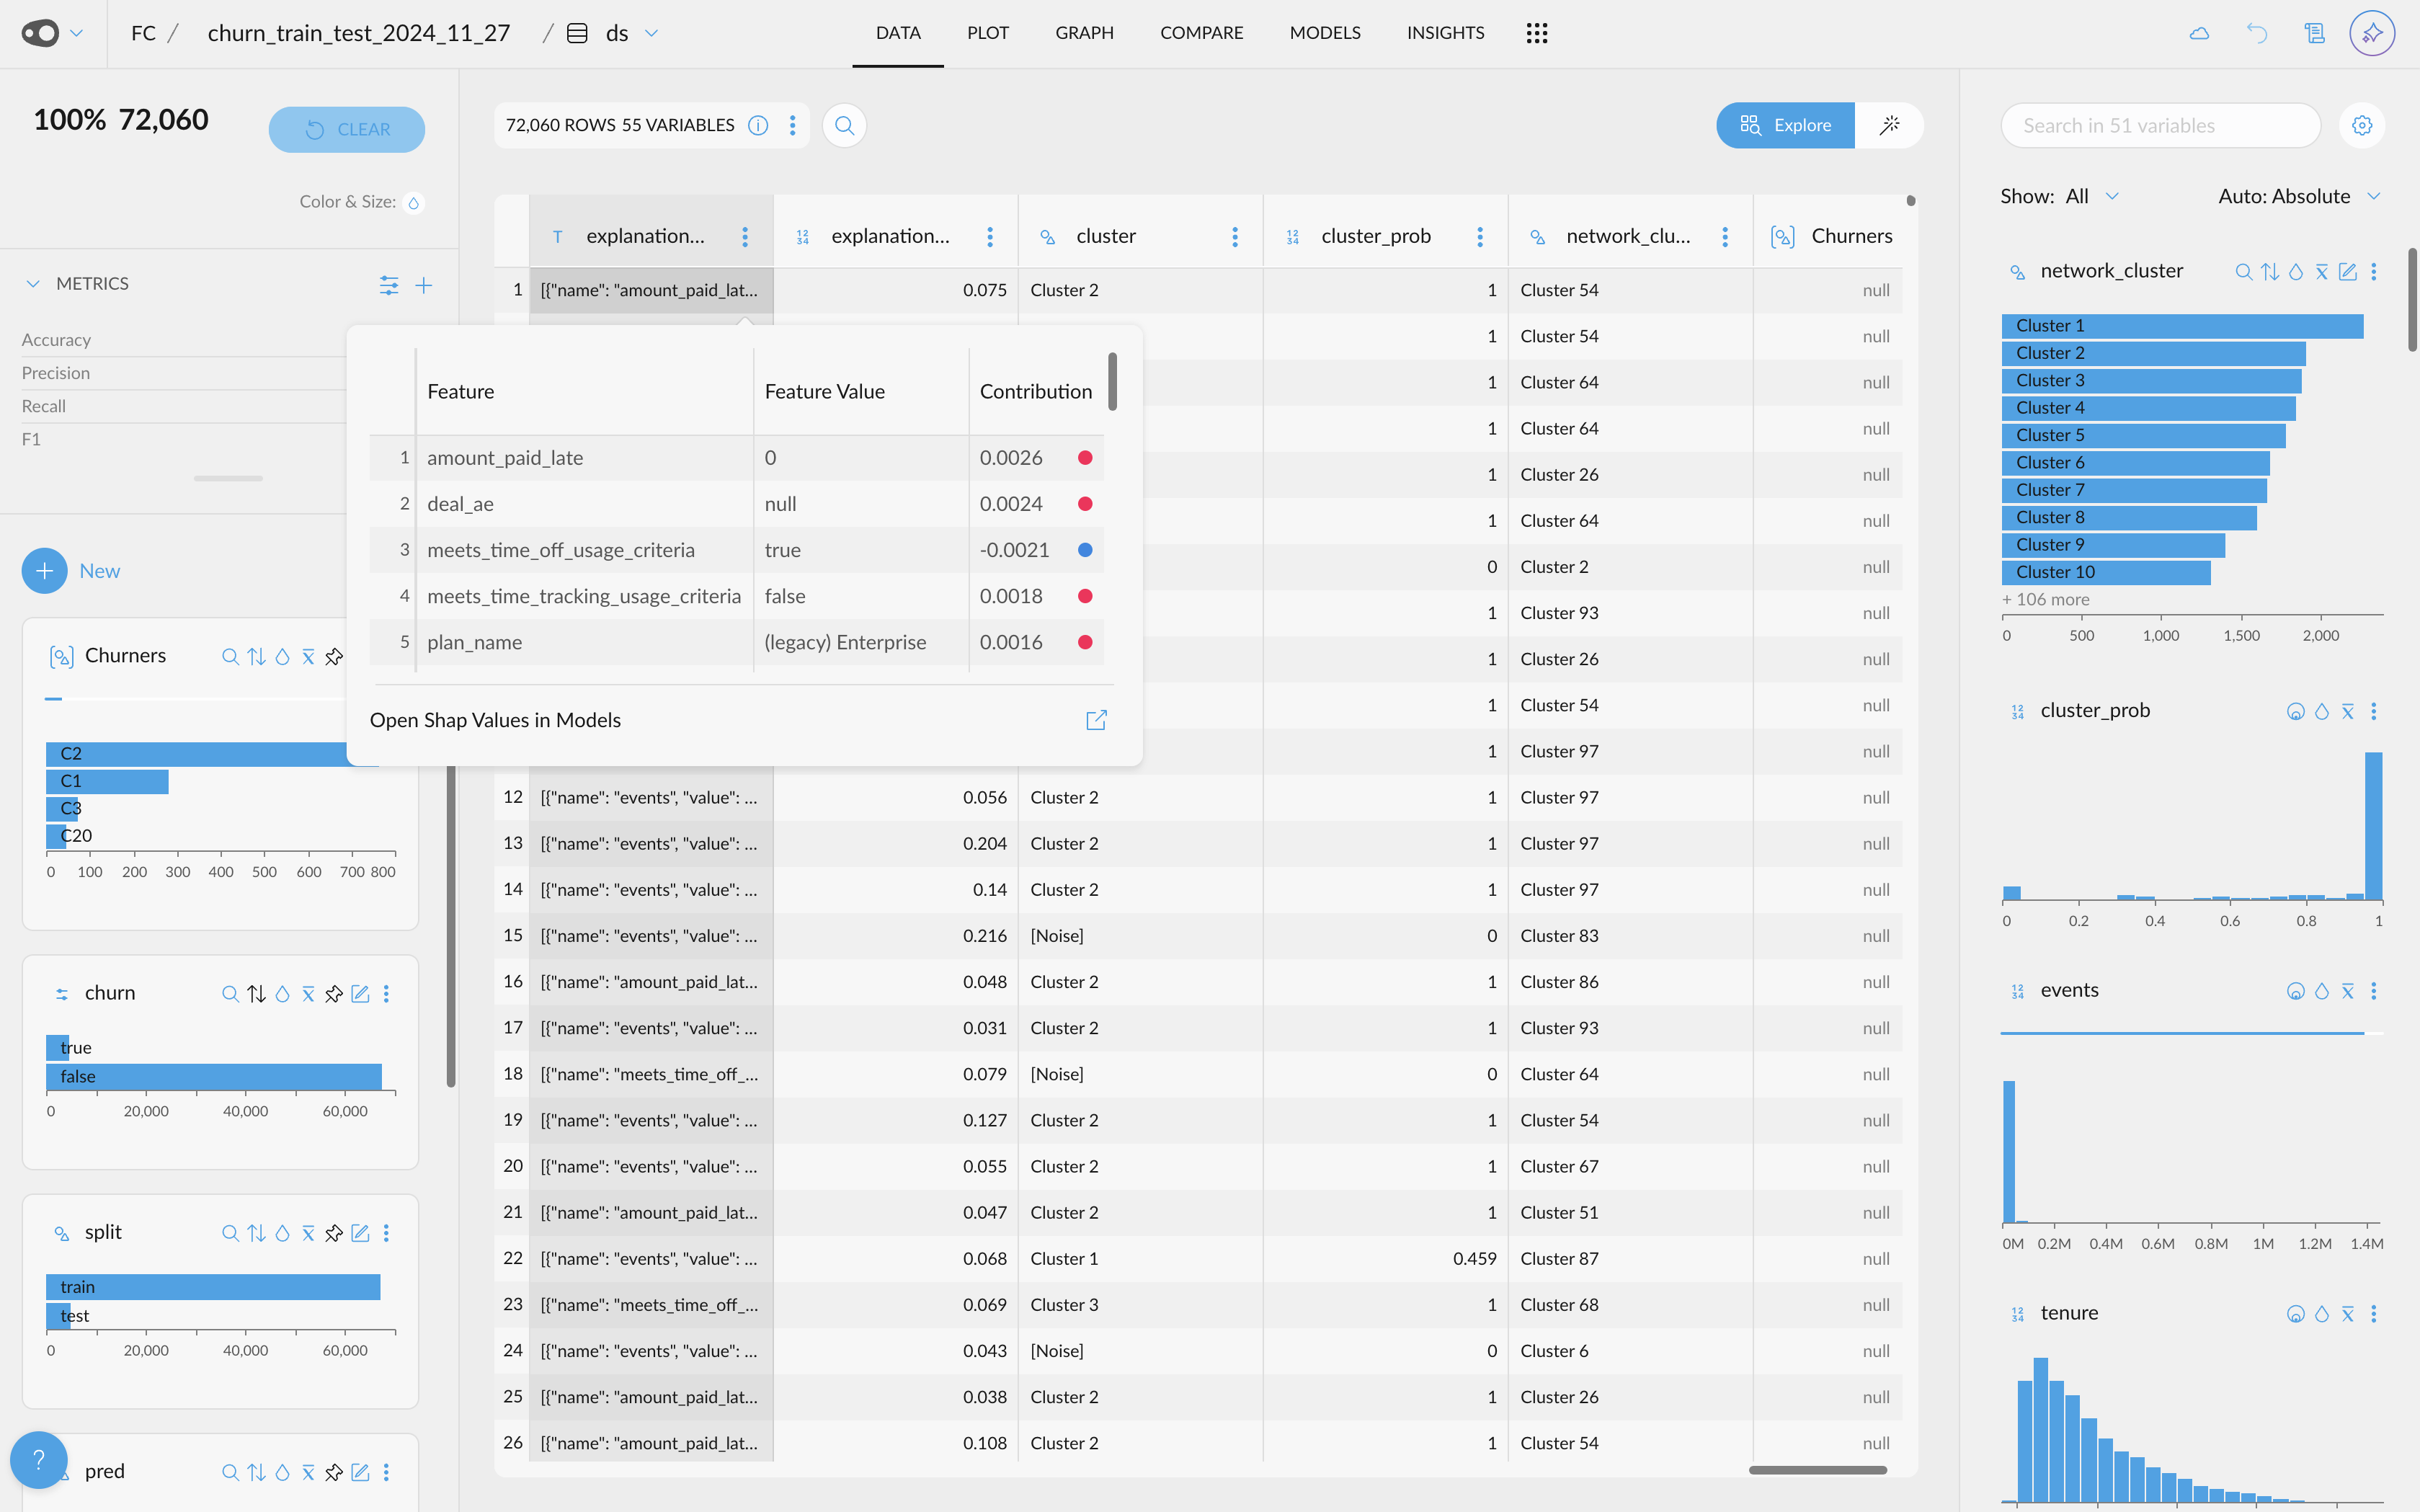
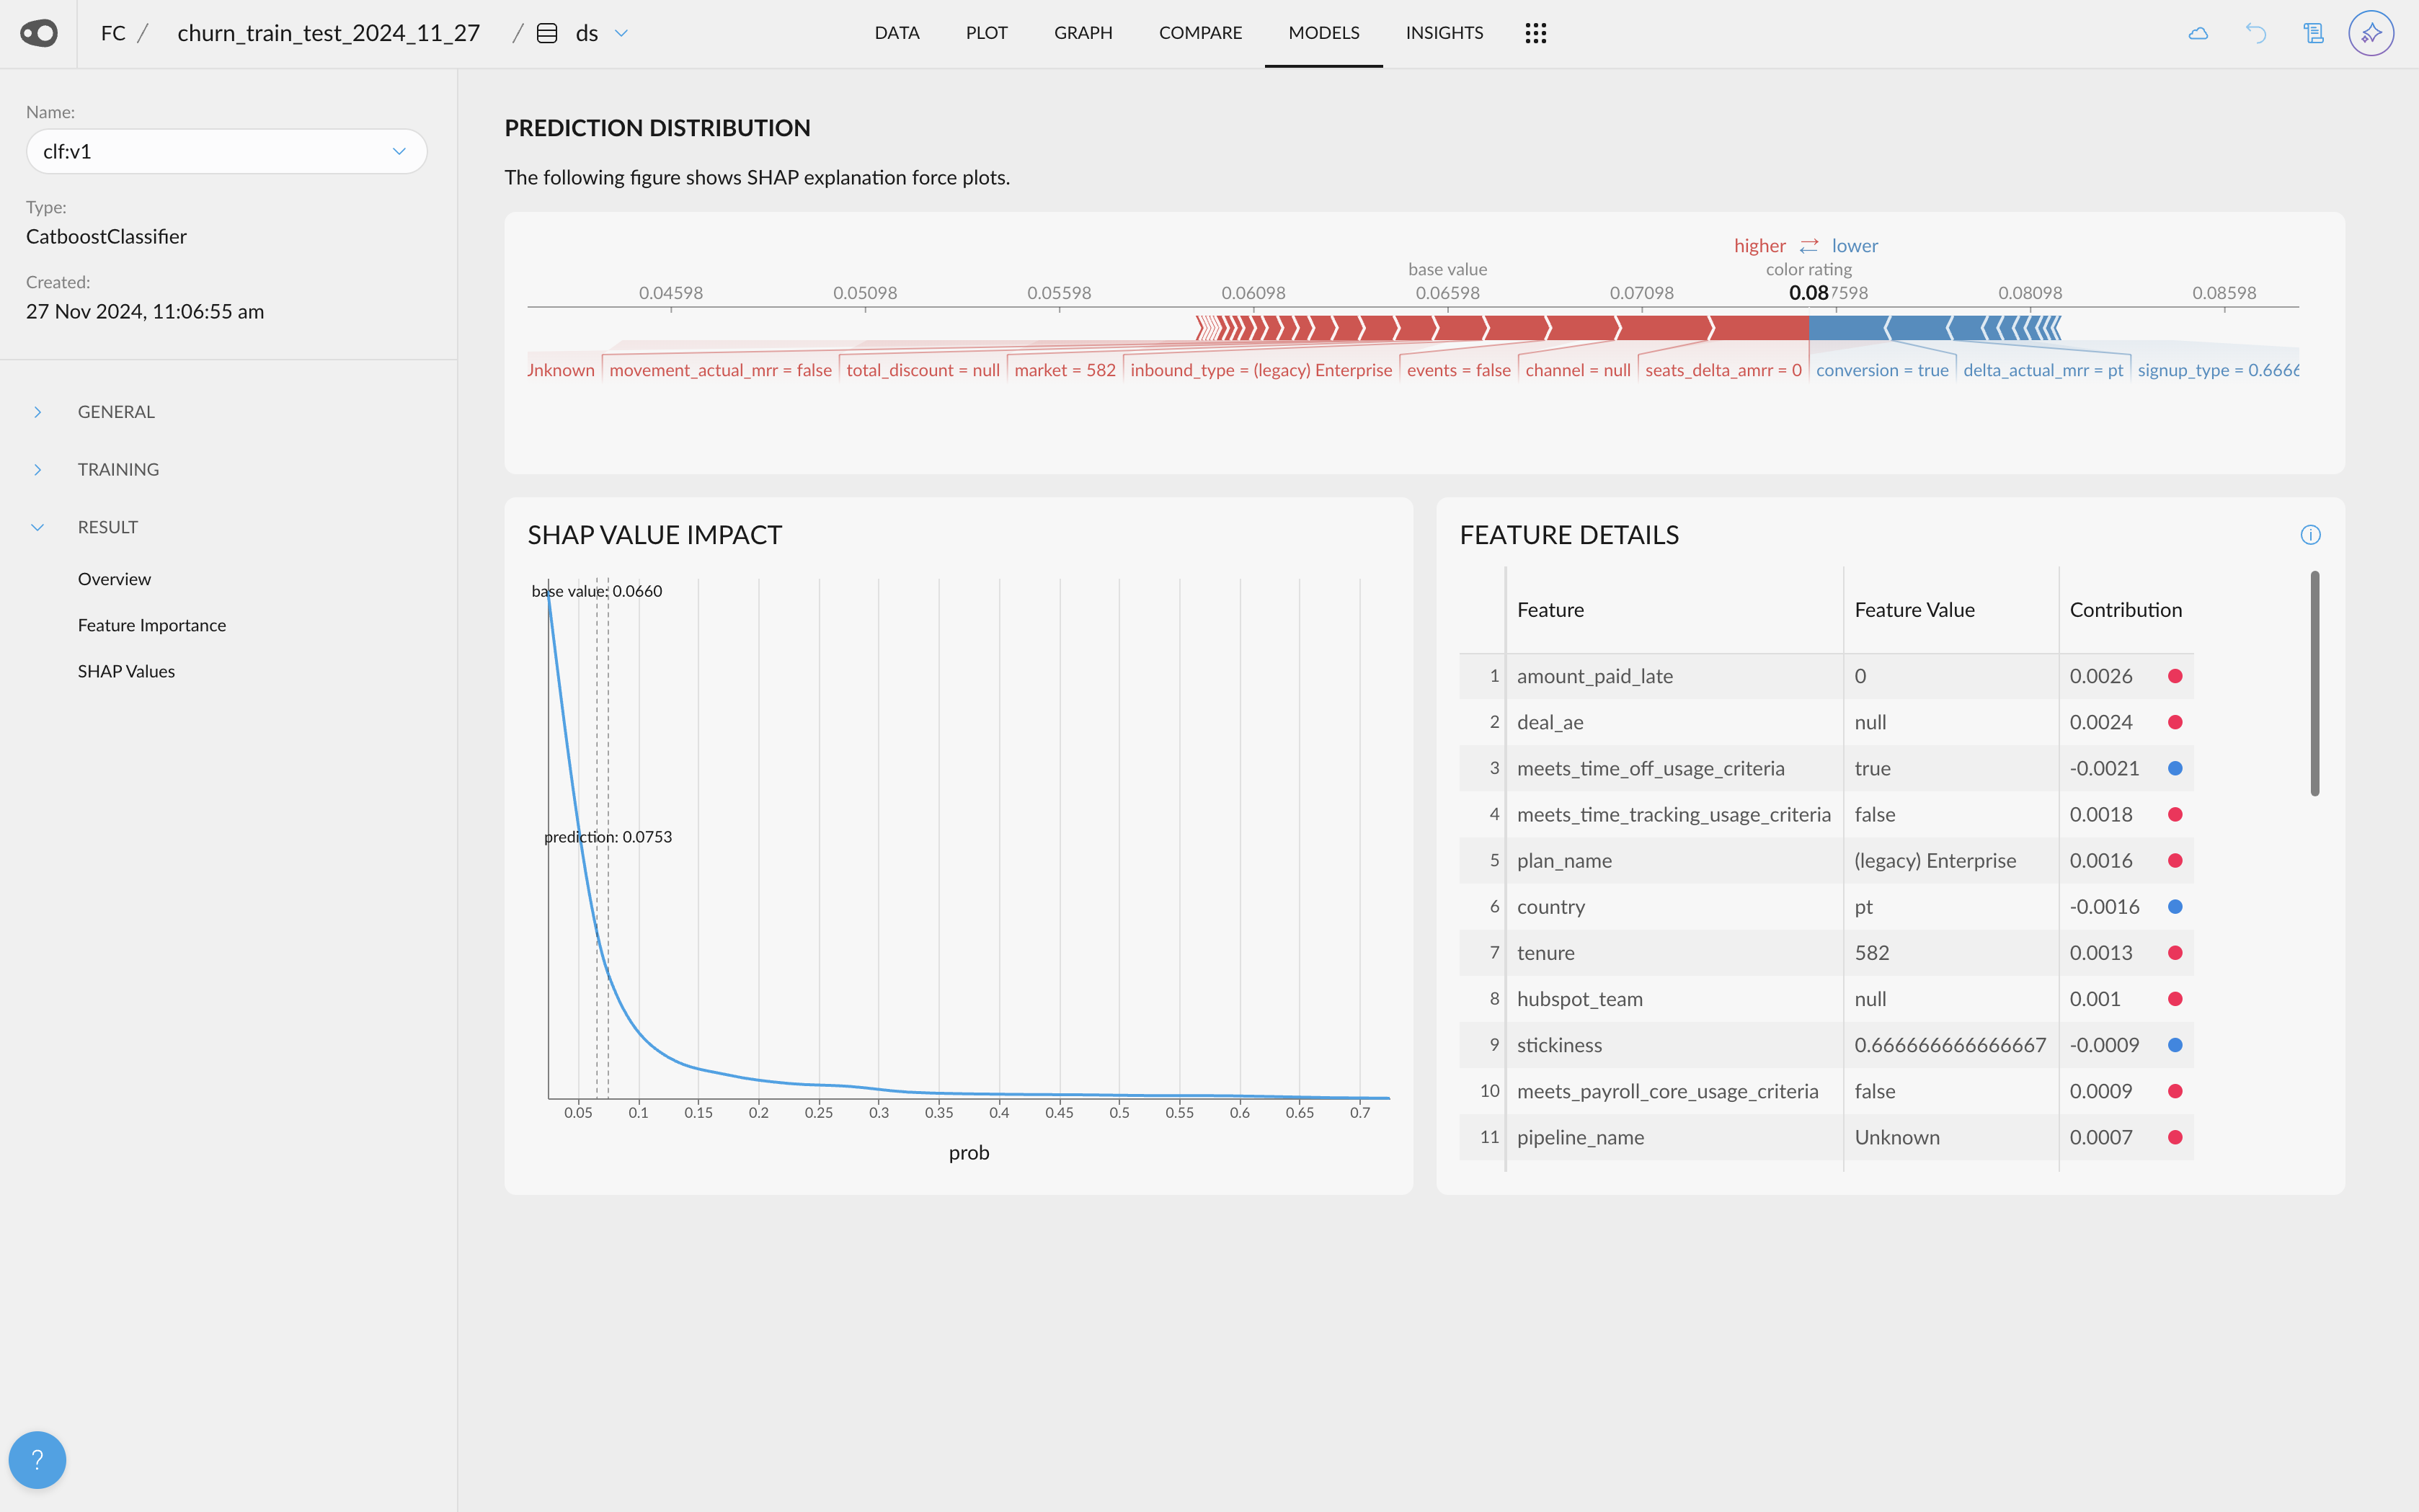
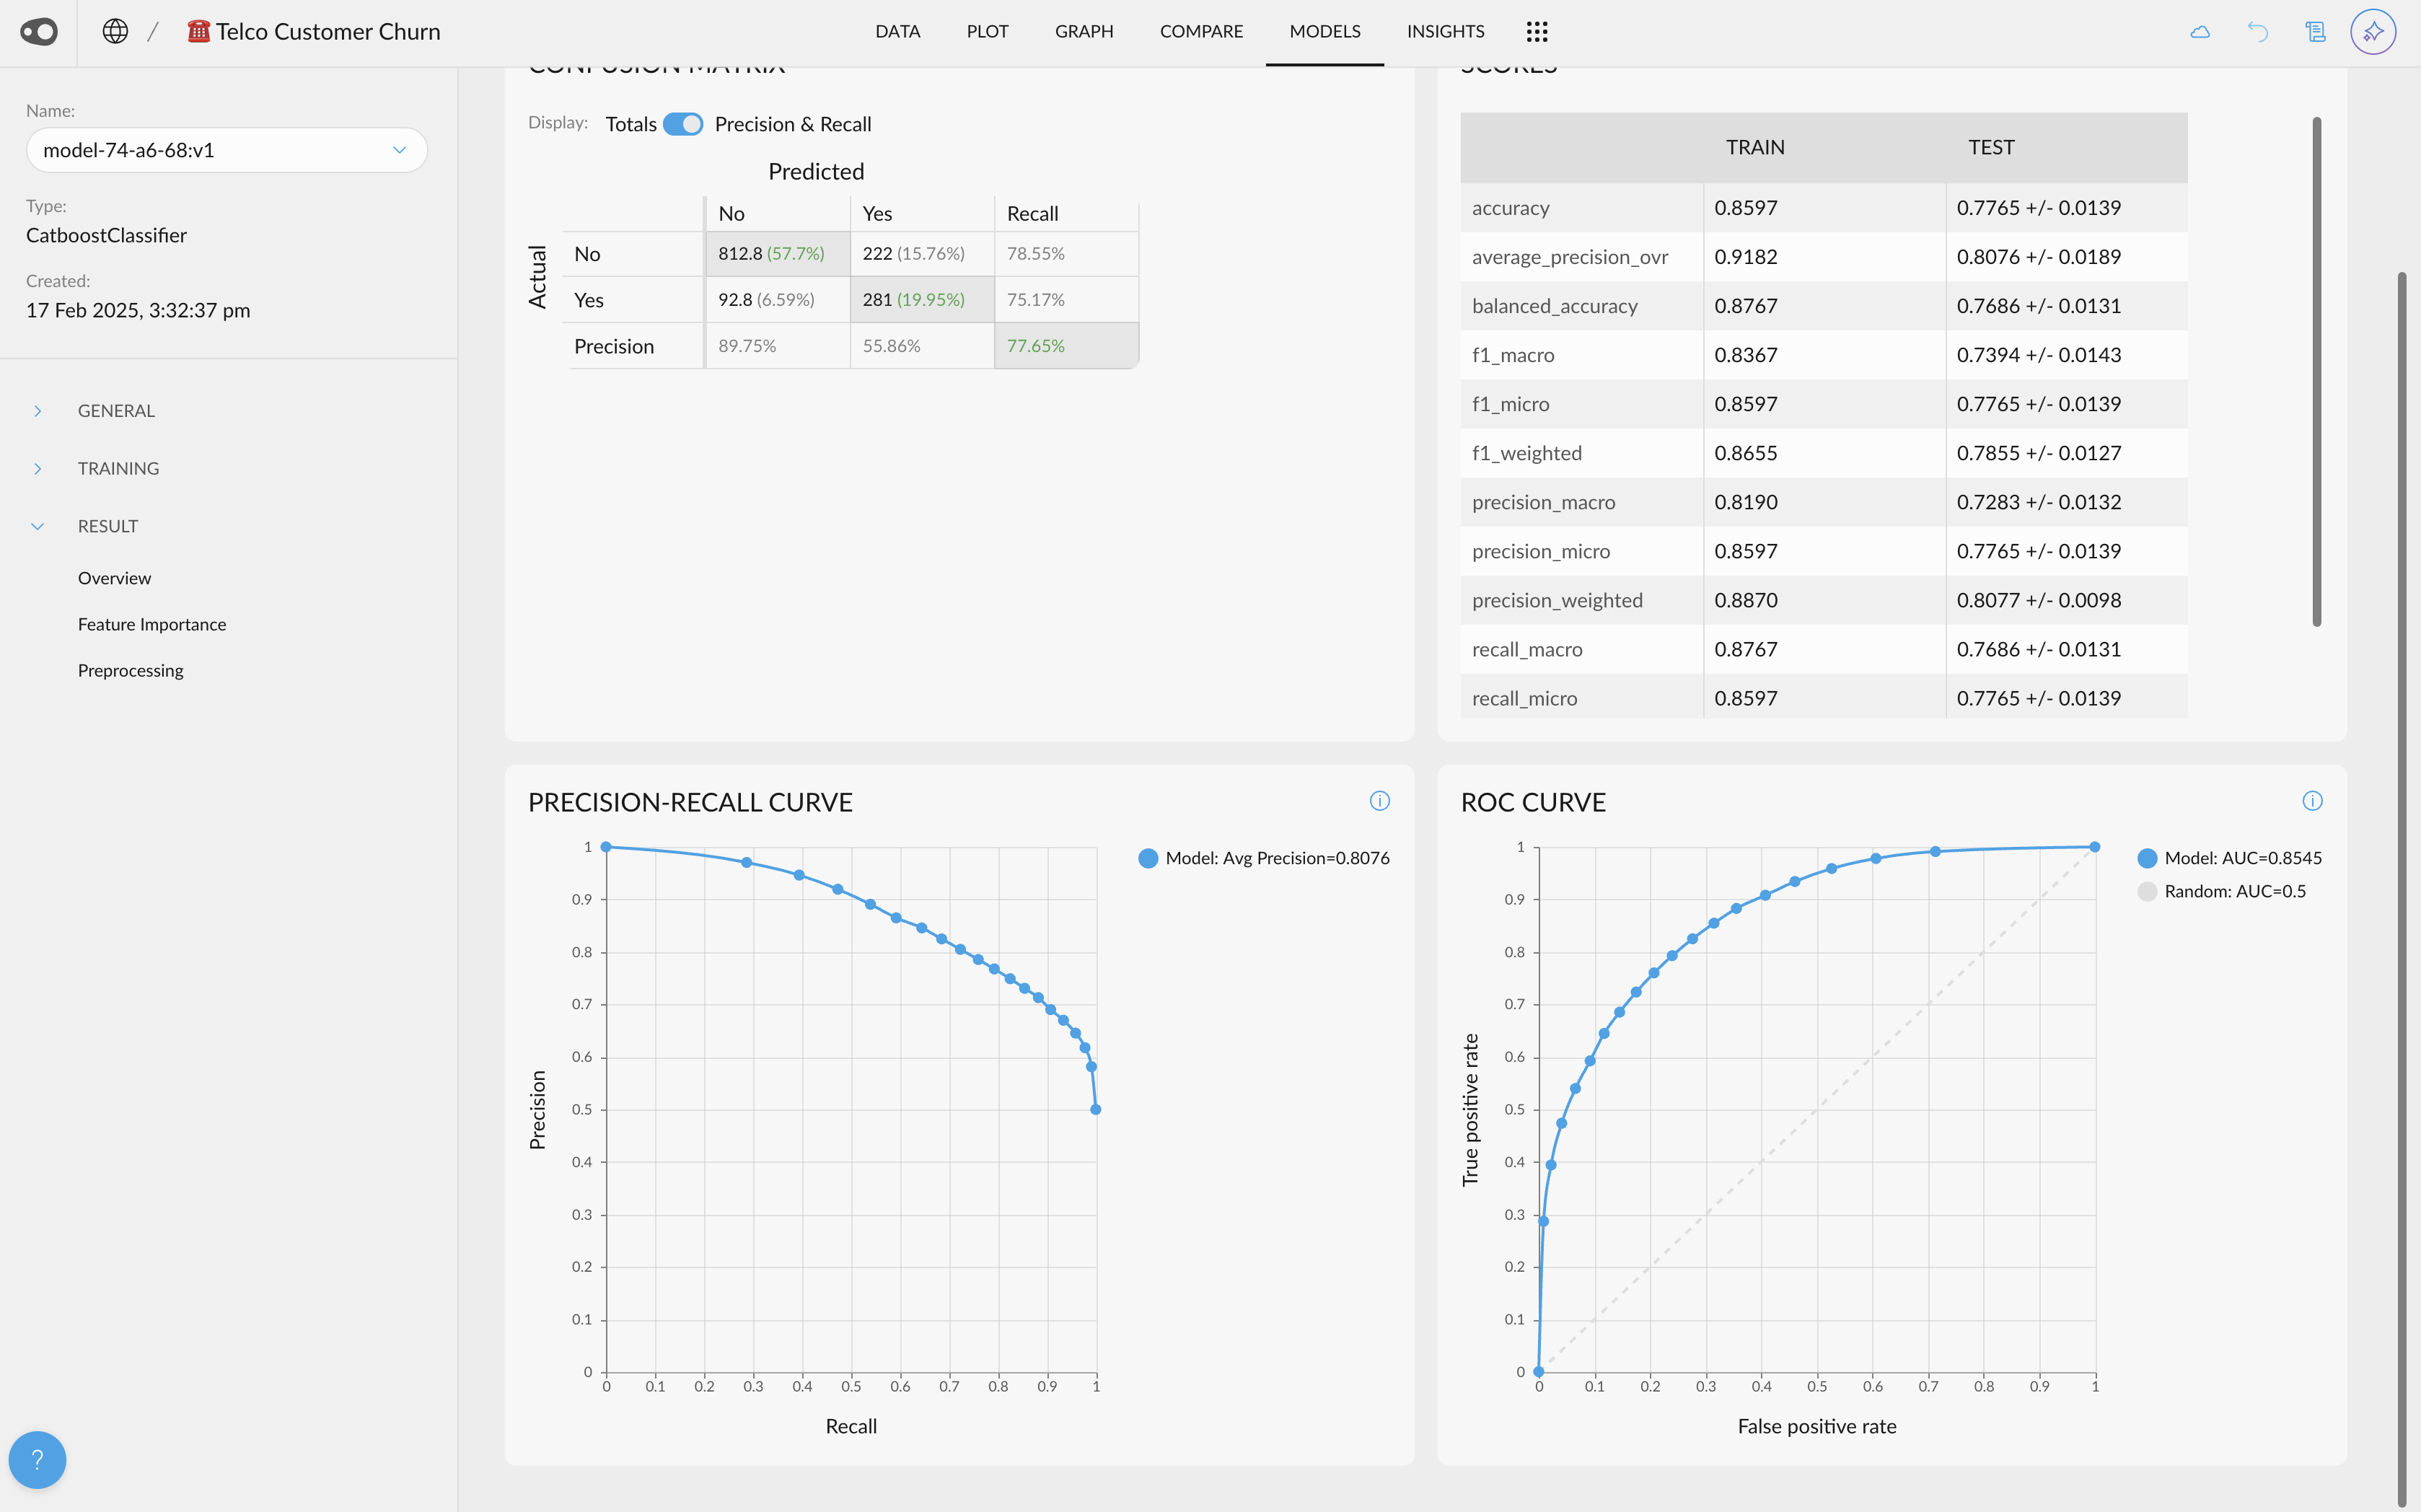
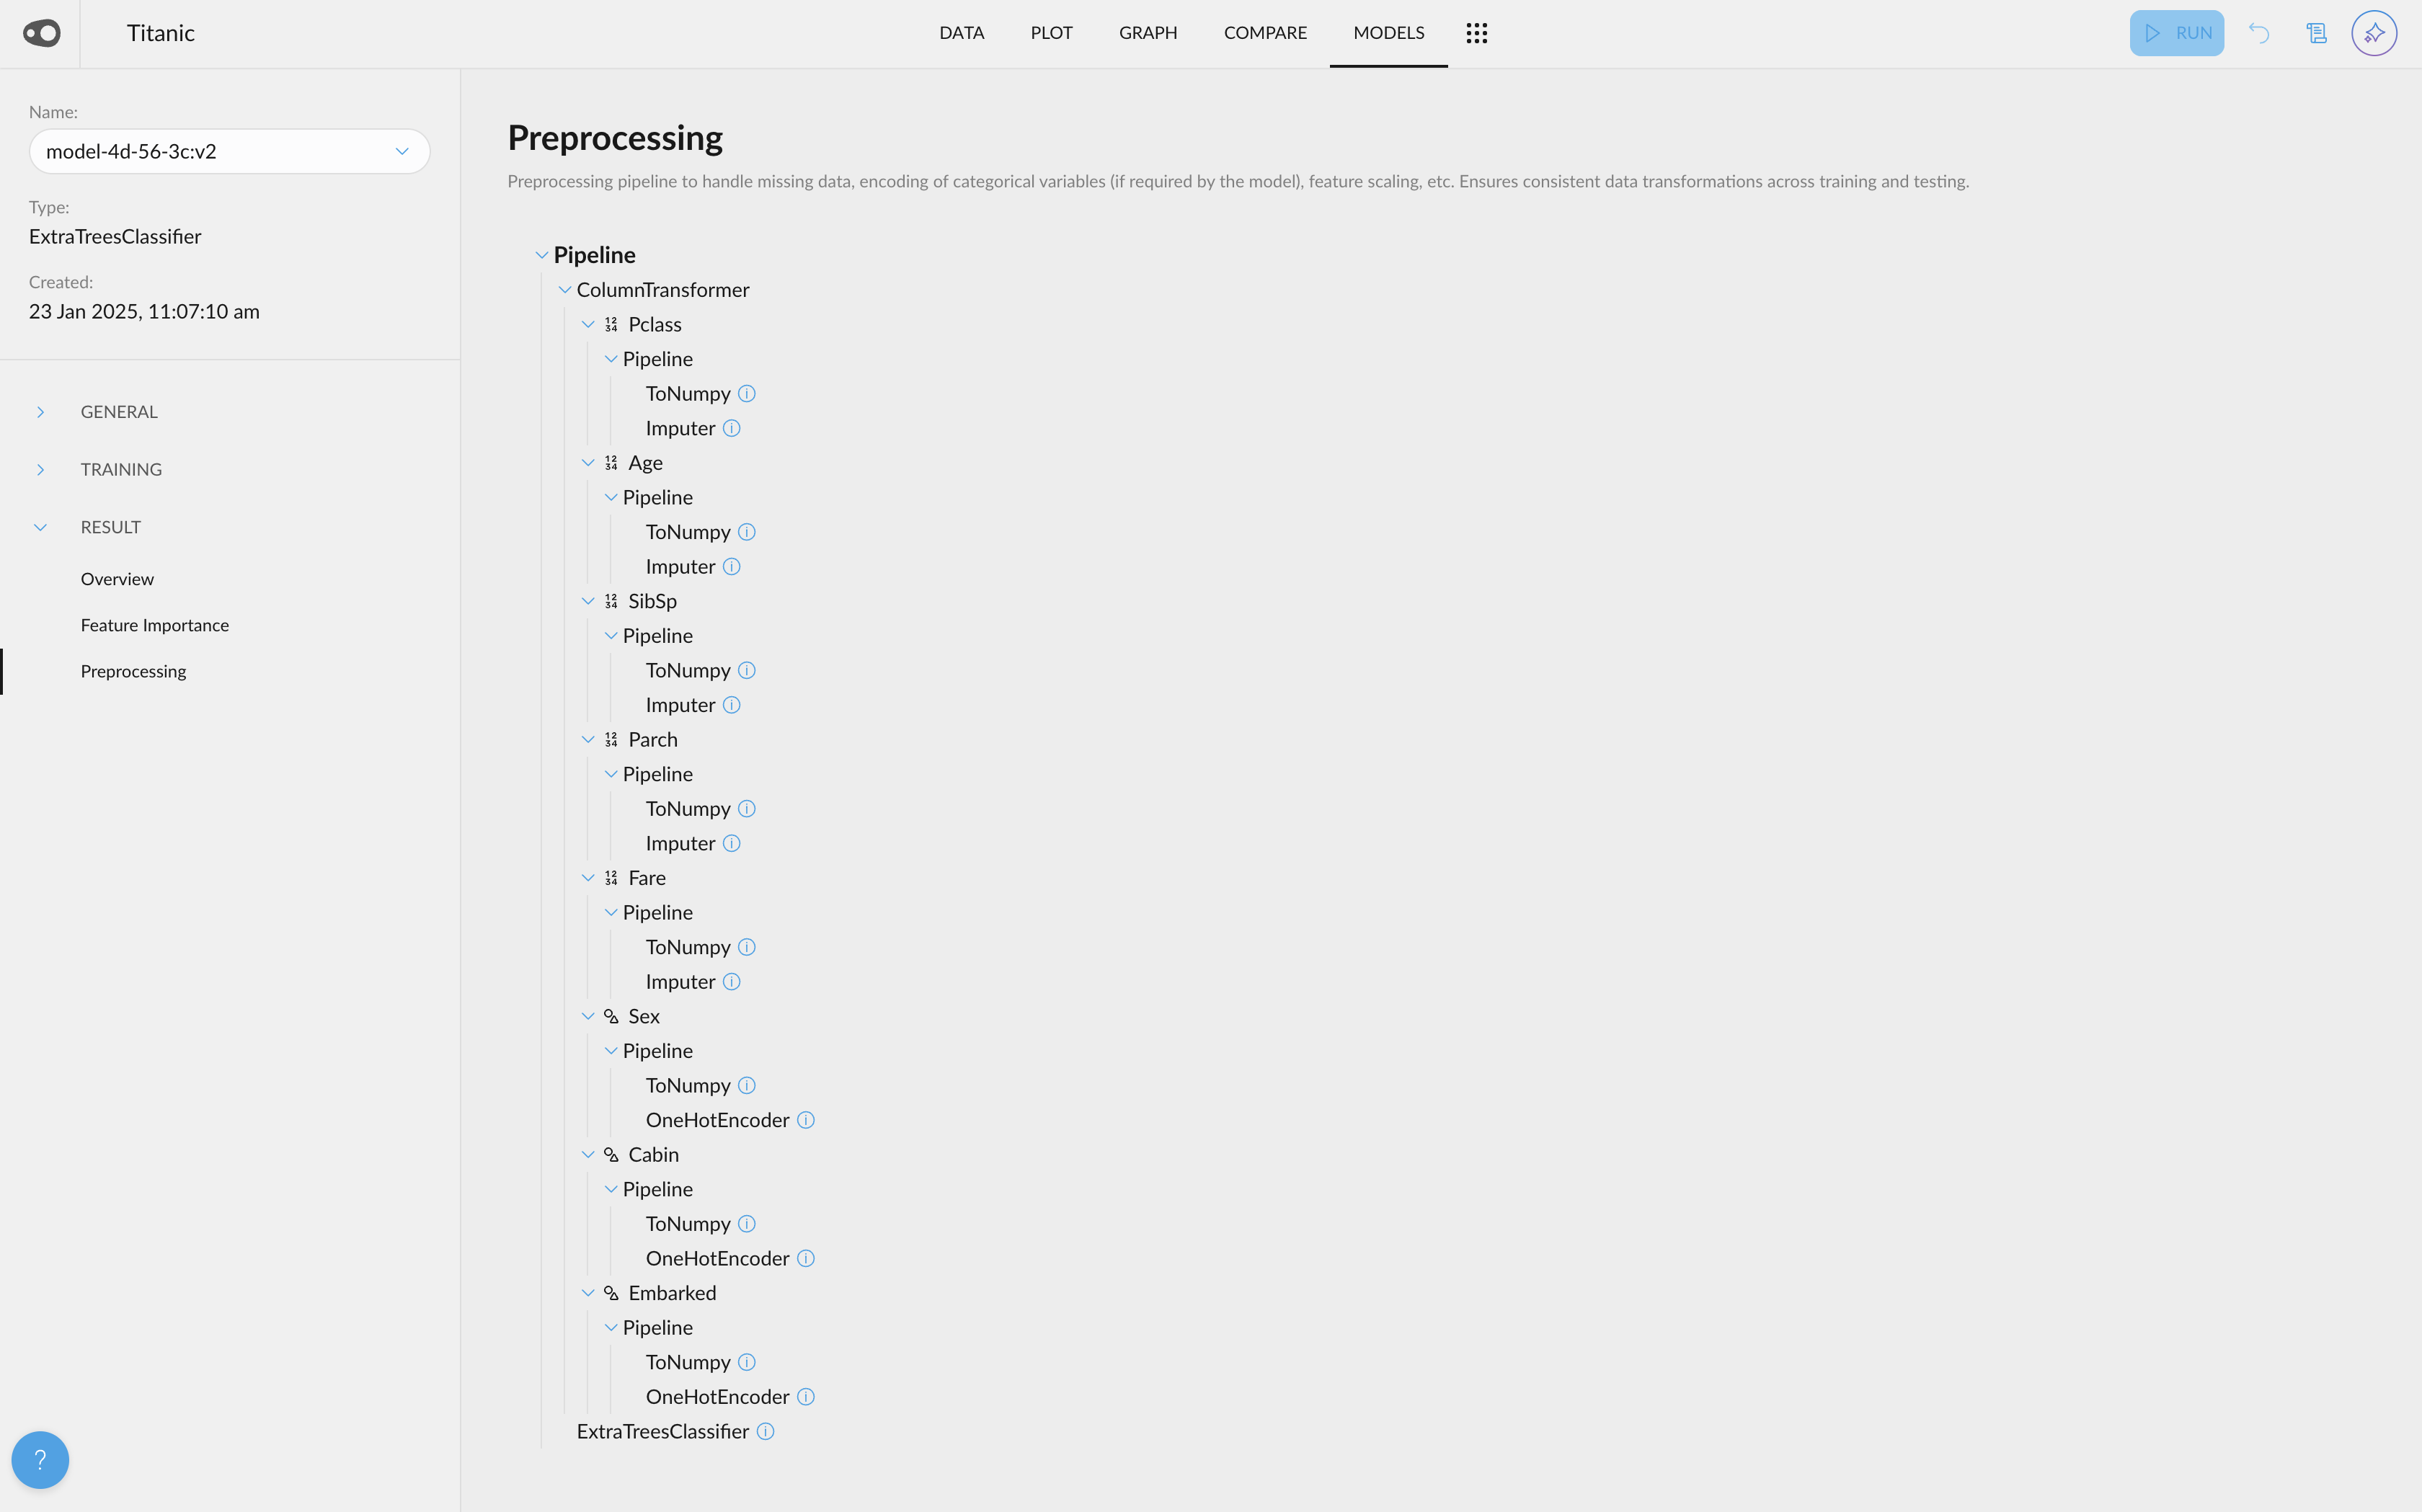
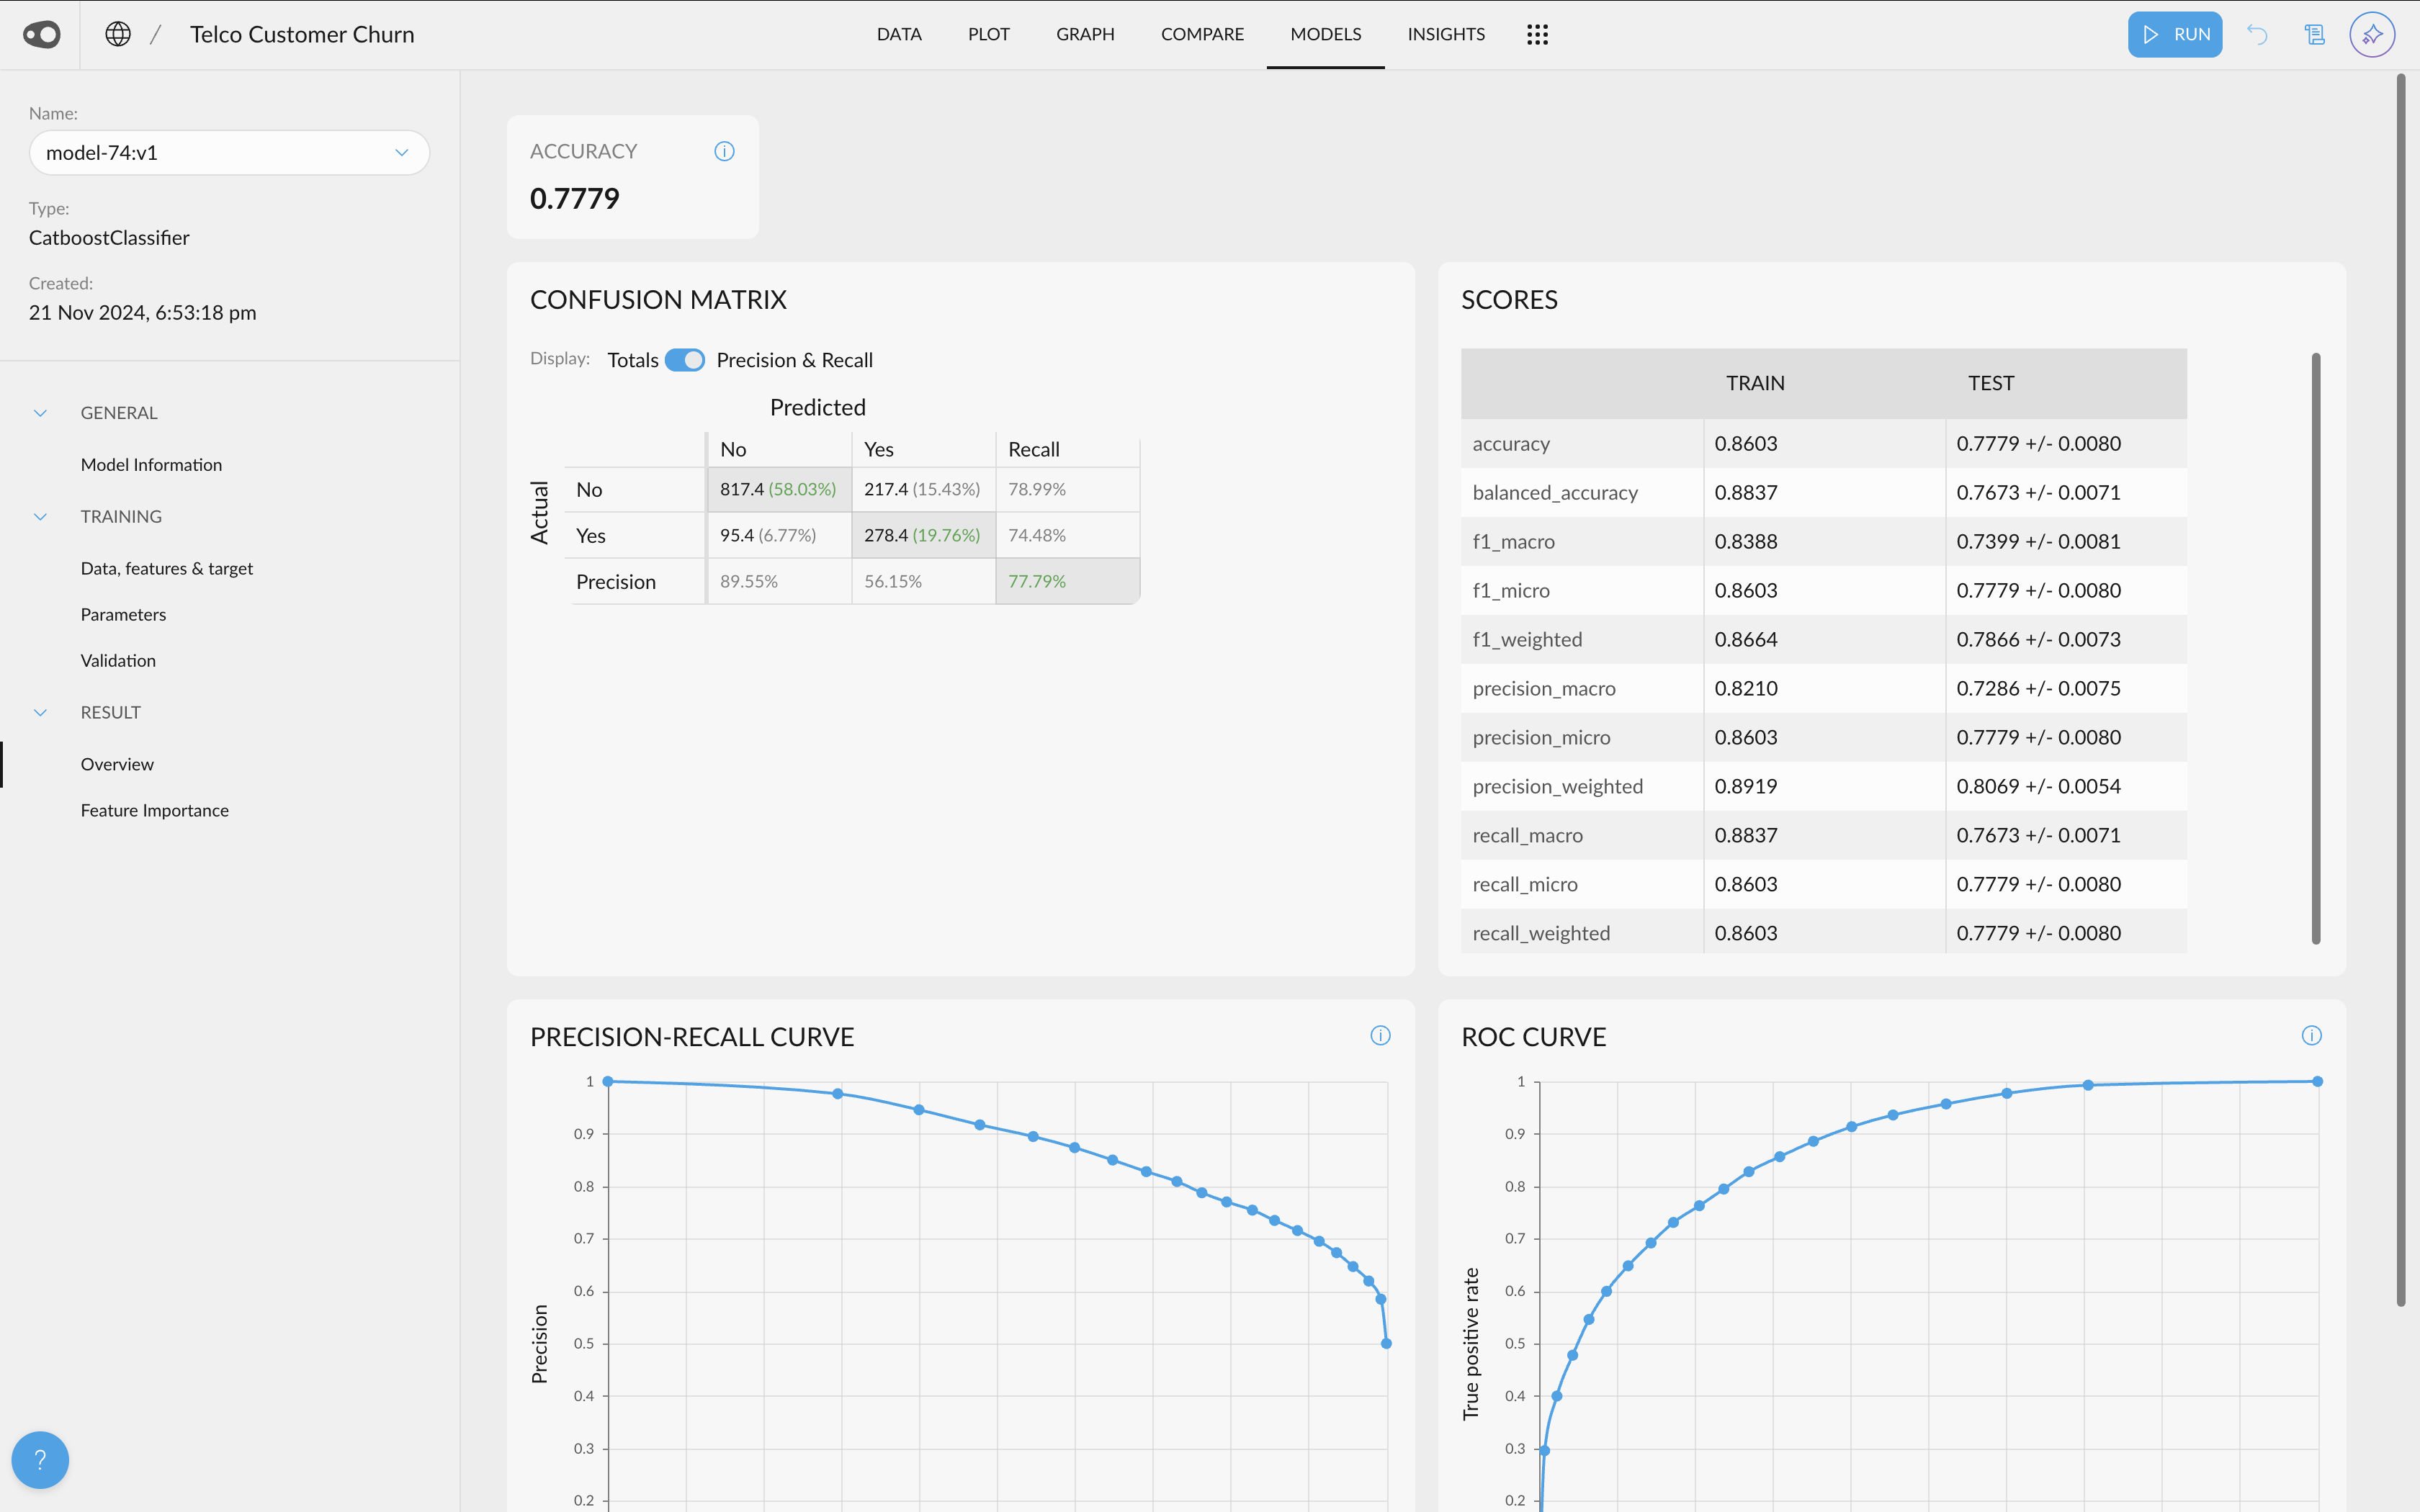
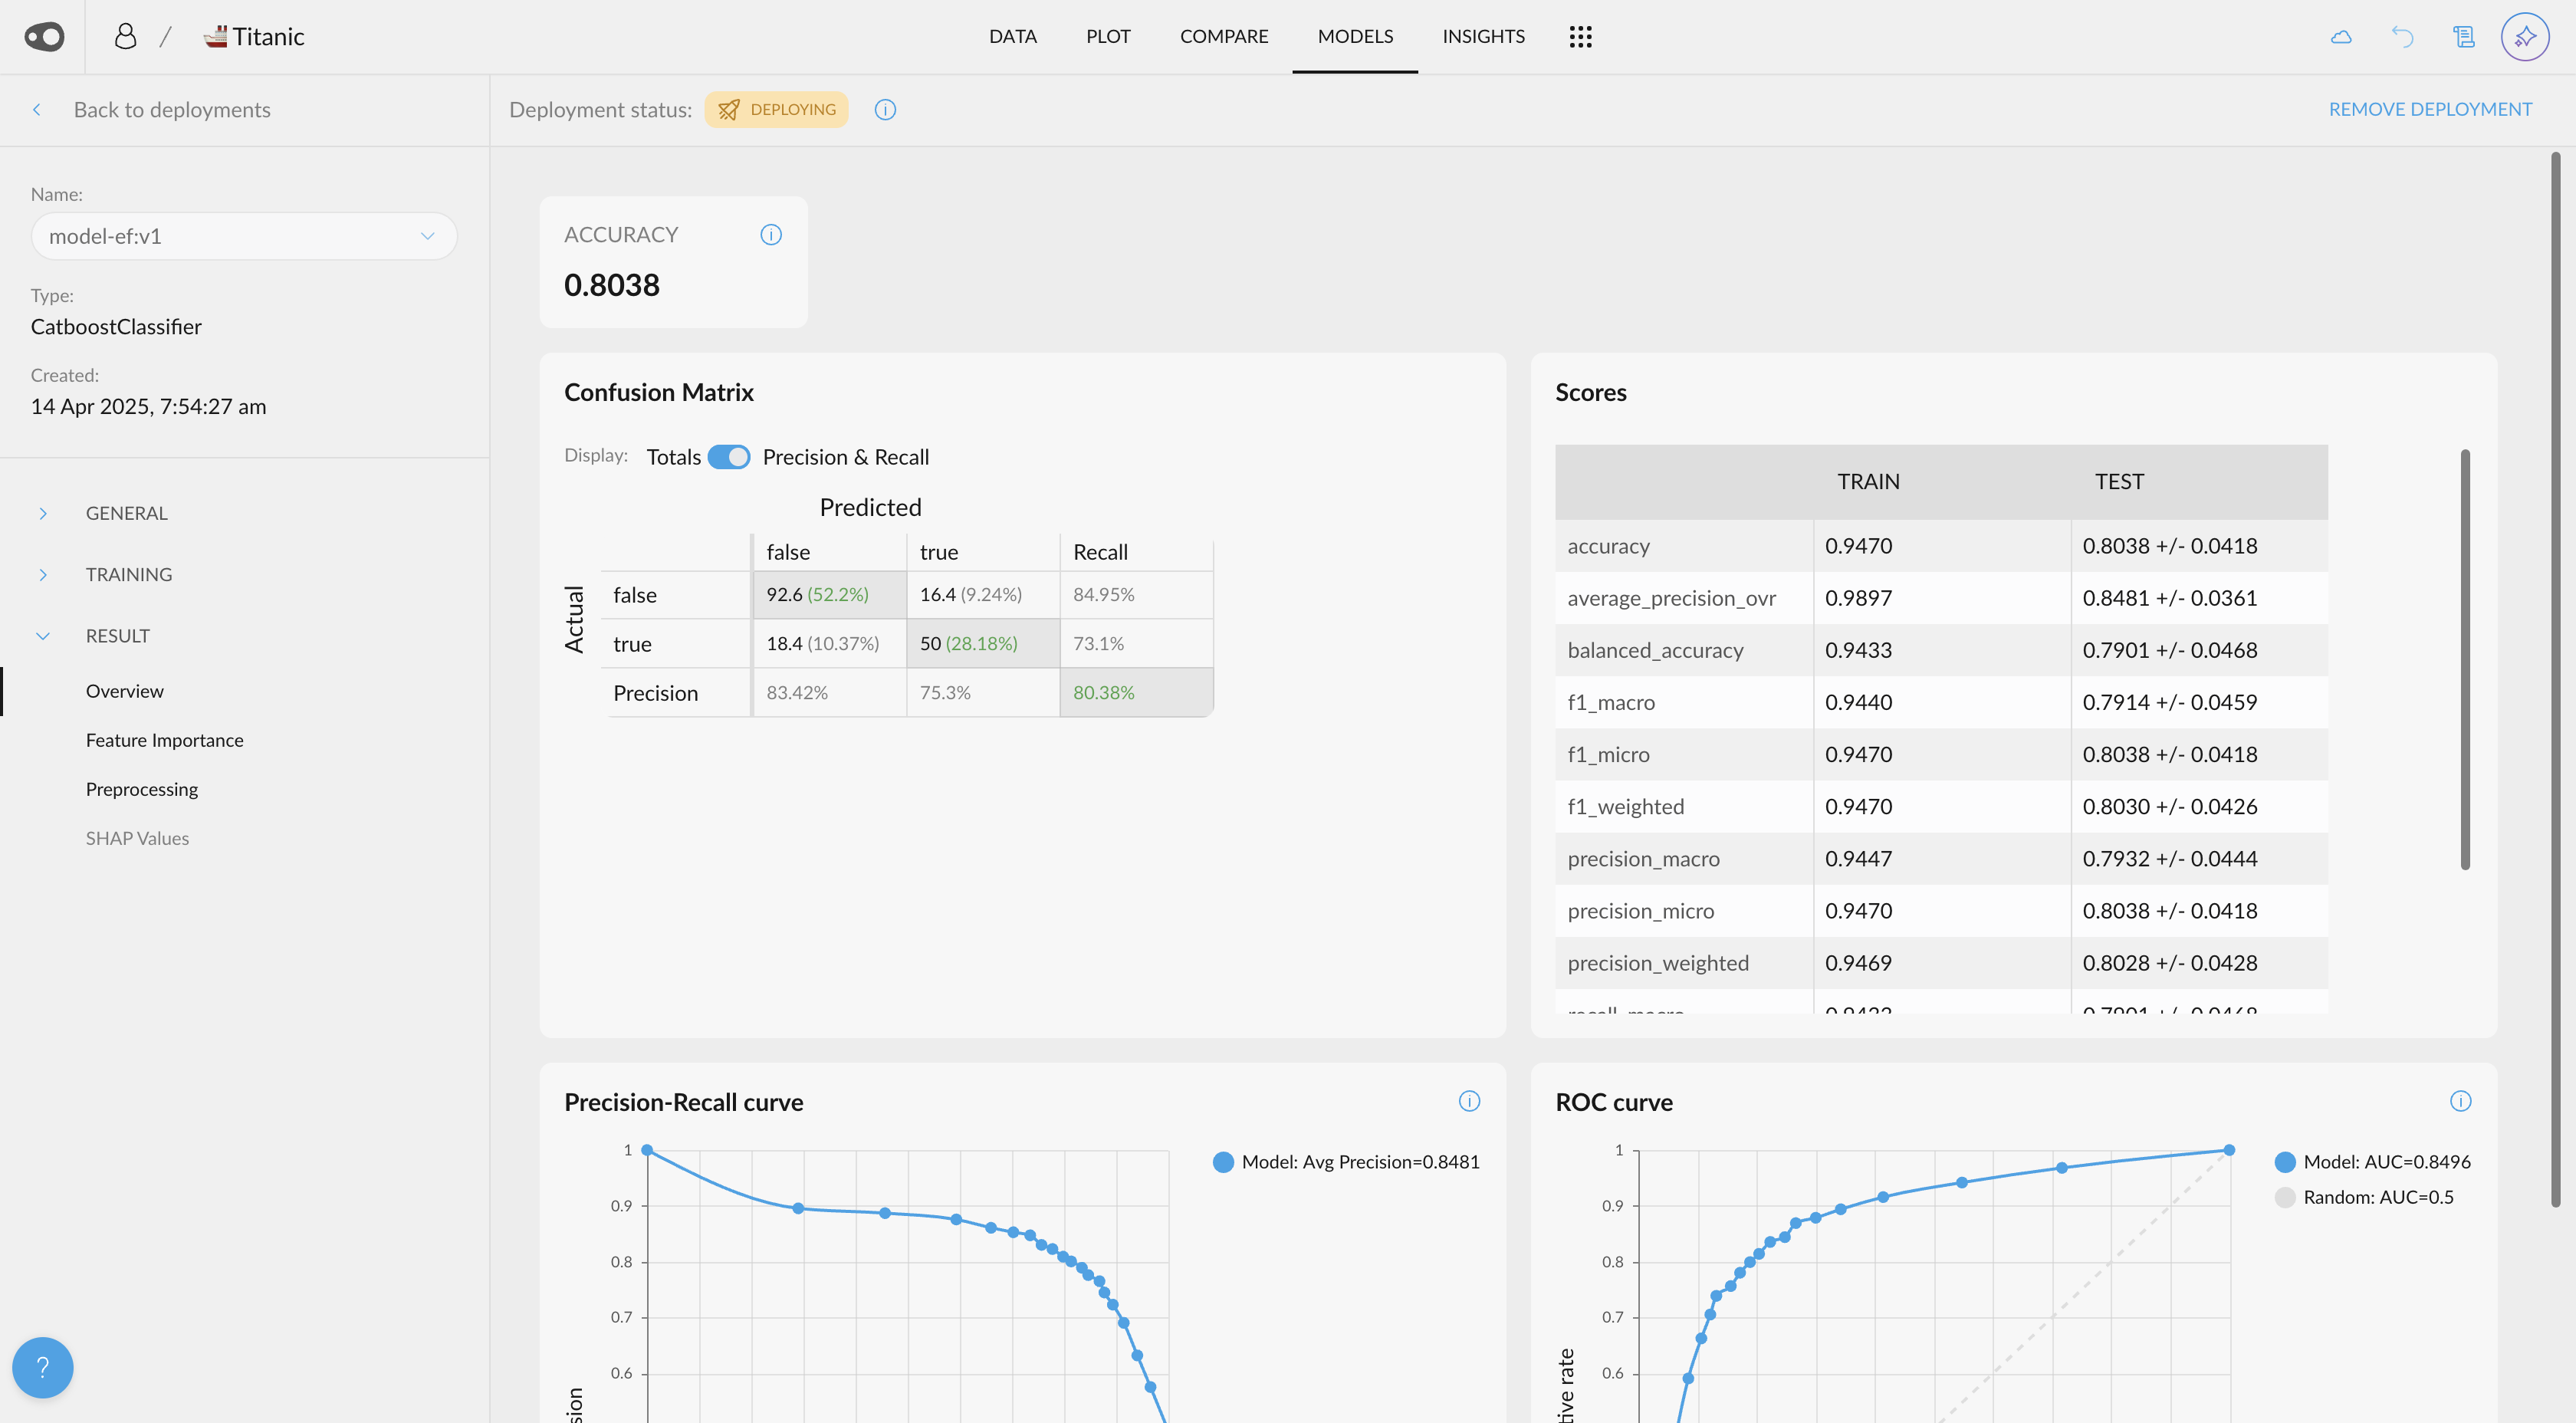
- Models home & models deployment. Models associated with a project are displayed in a new home view that highlights their most relevant information. Additionally, you can deploy your models, which will automatically generate API endpoints along with interactive documentation for easy exploration.

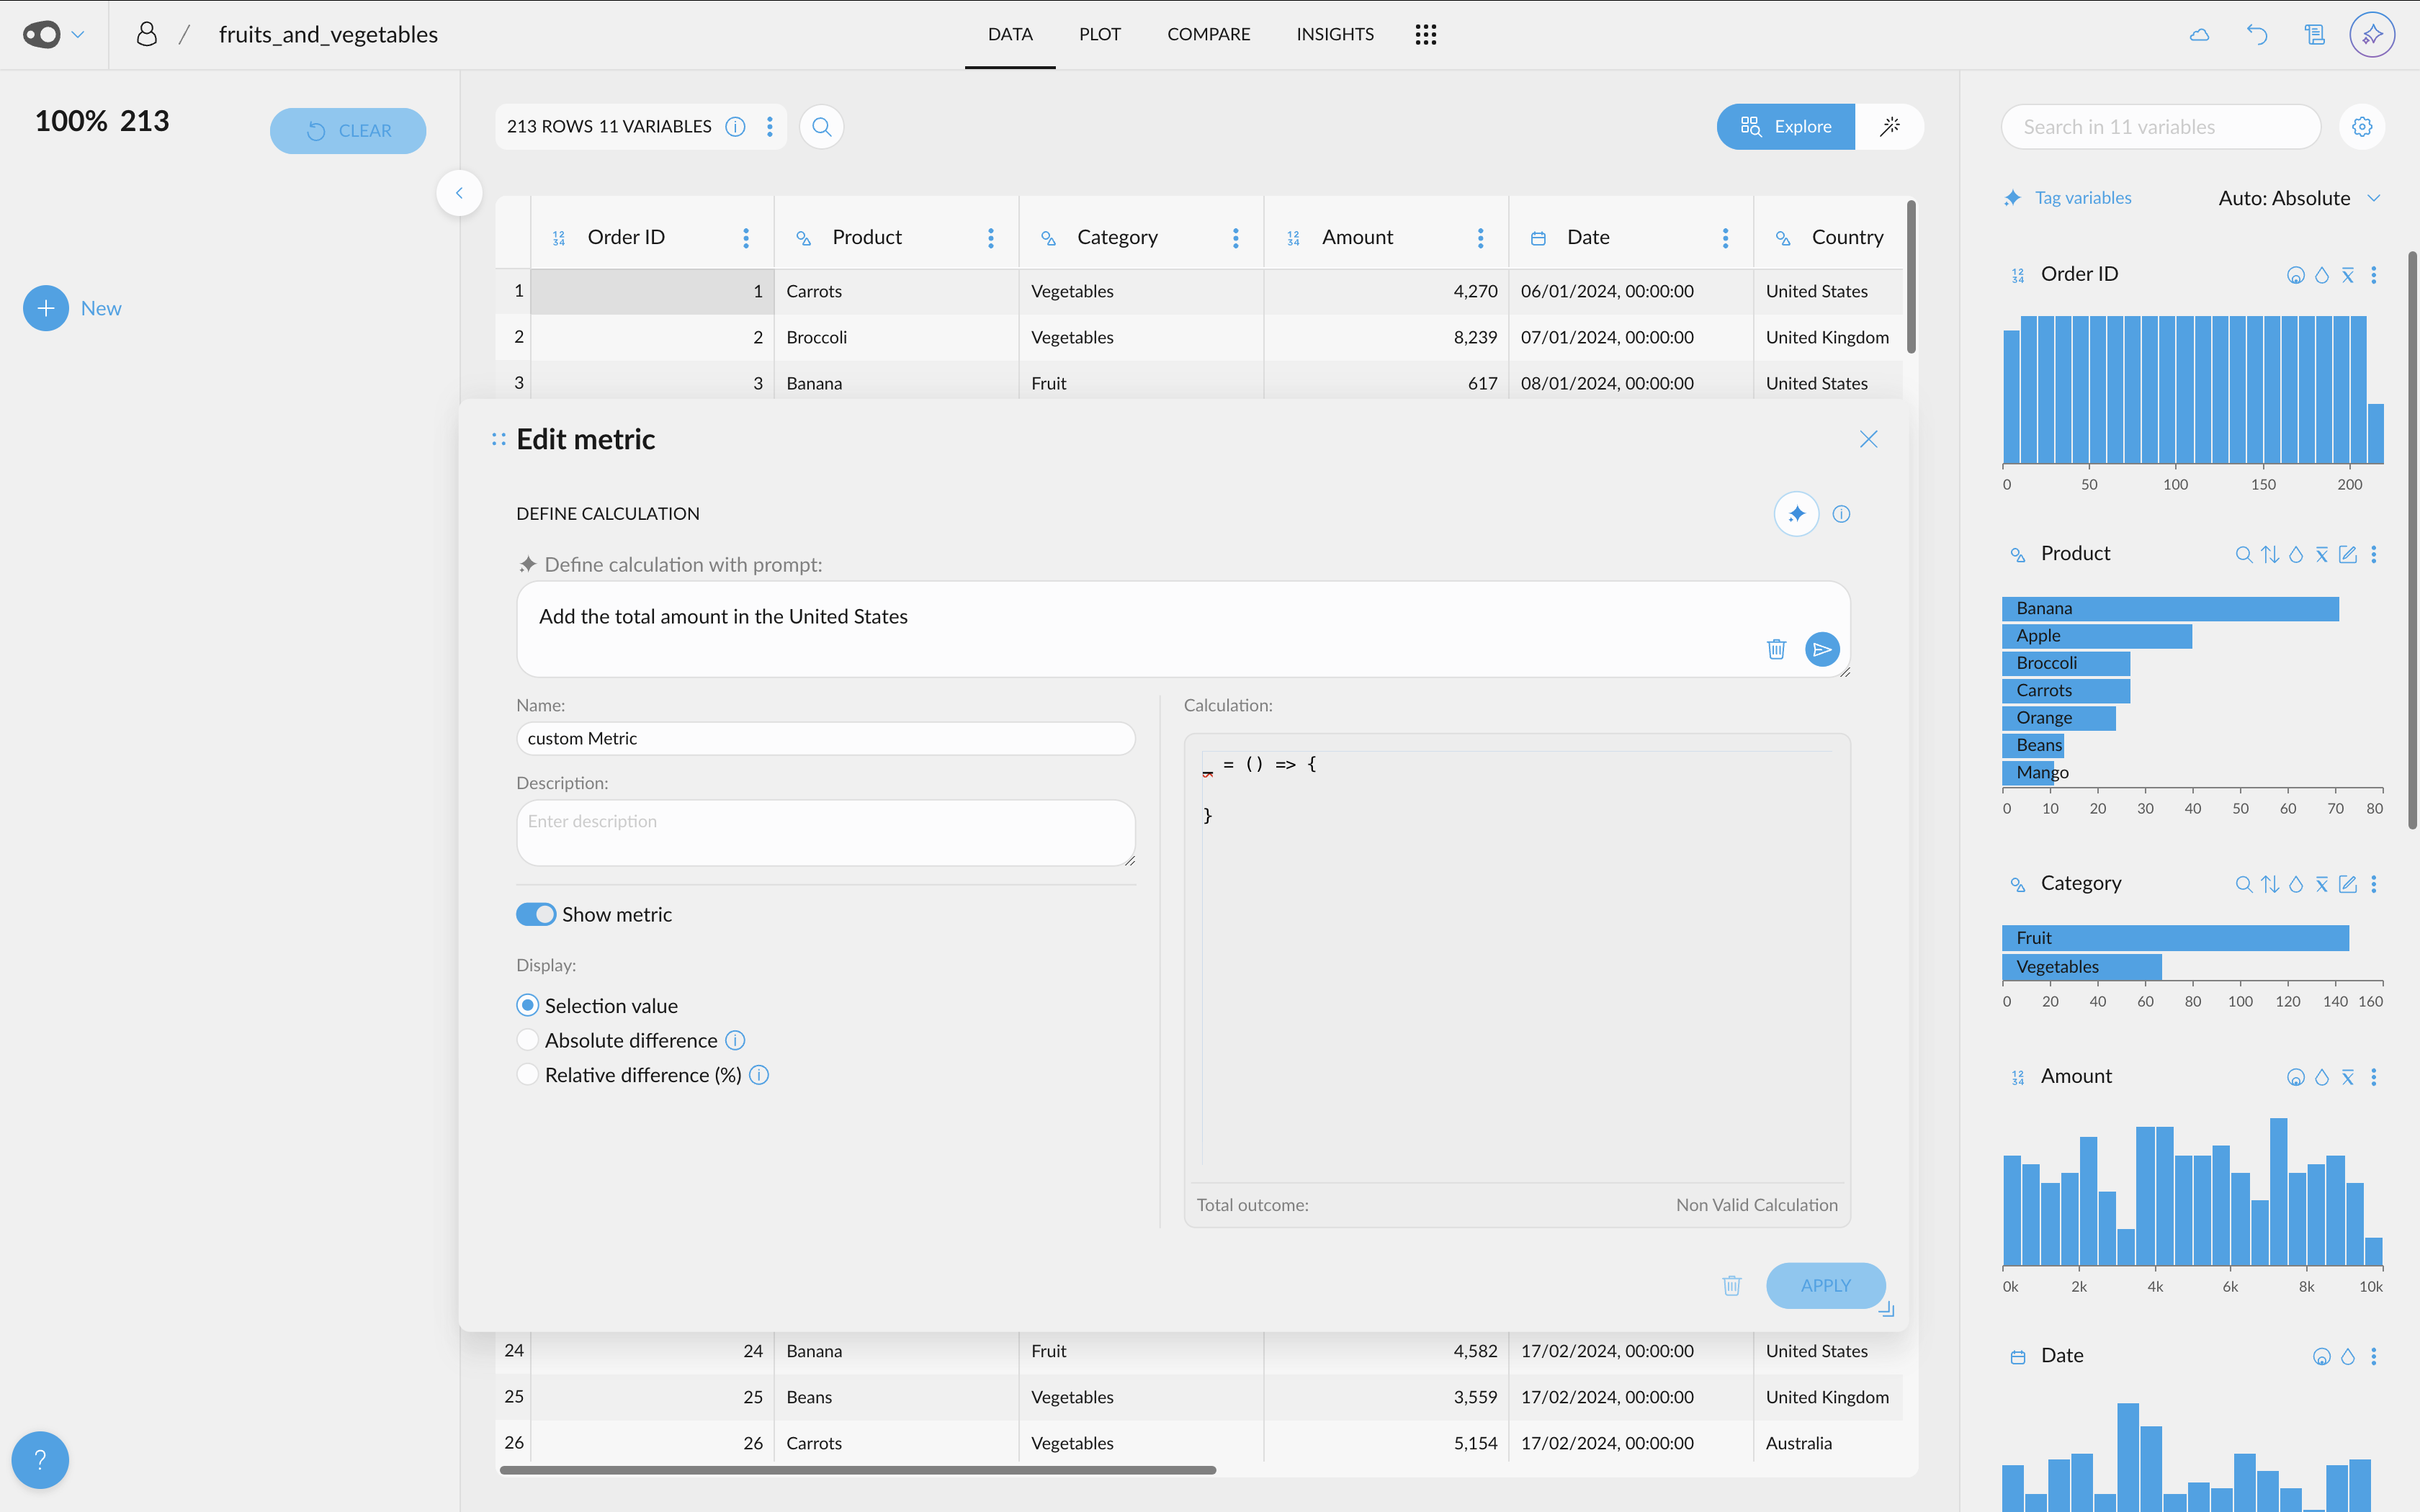
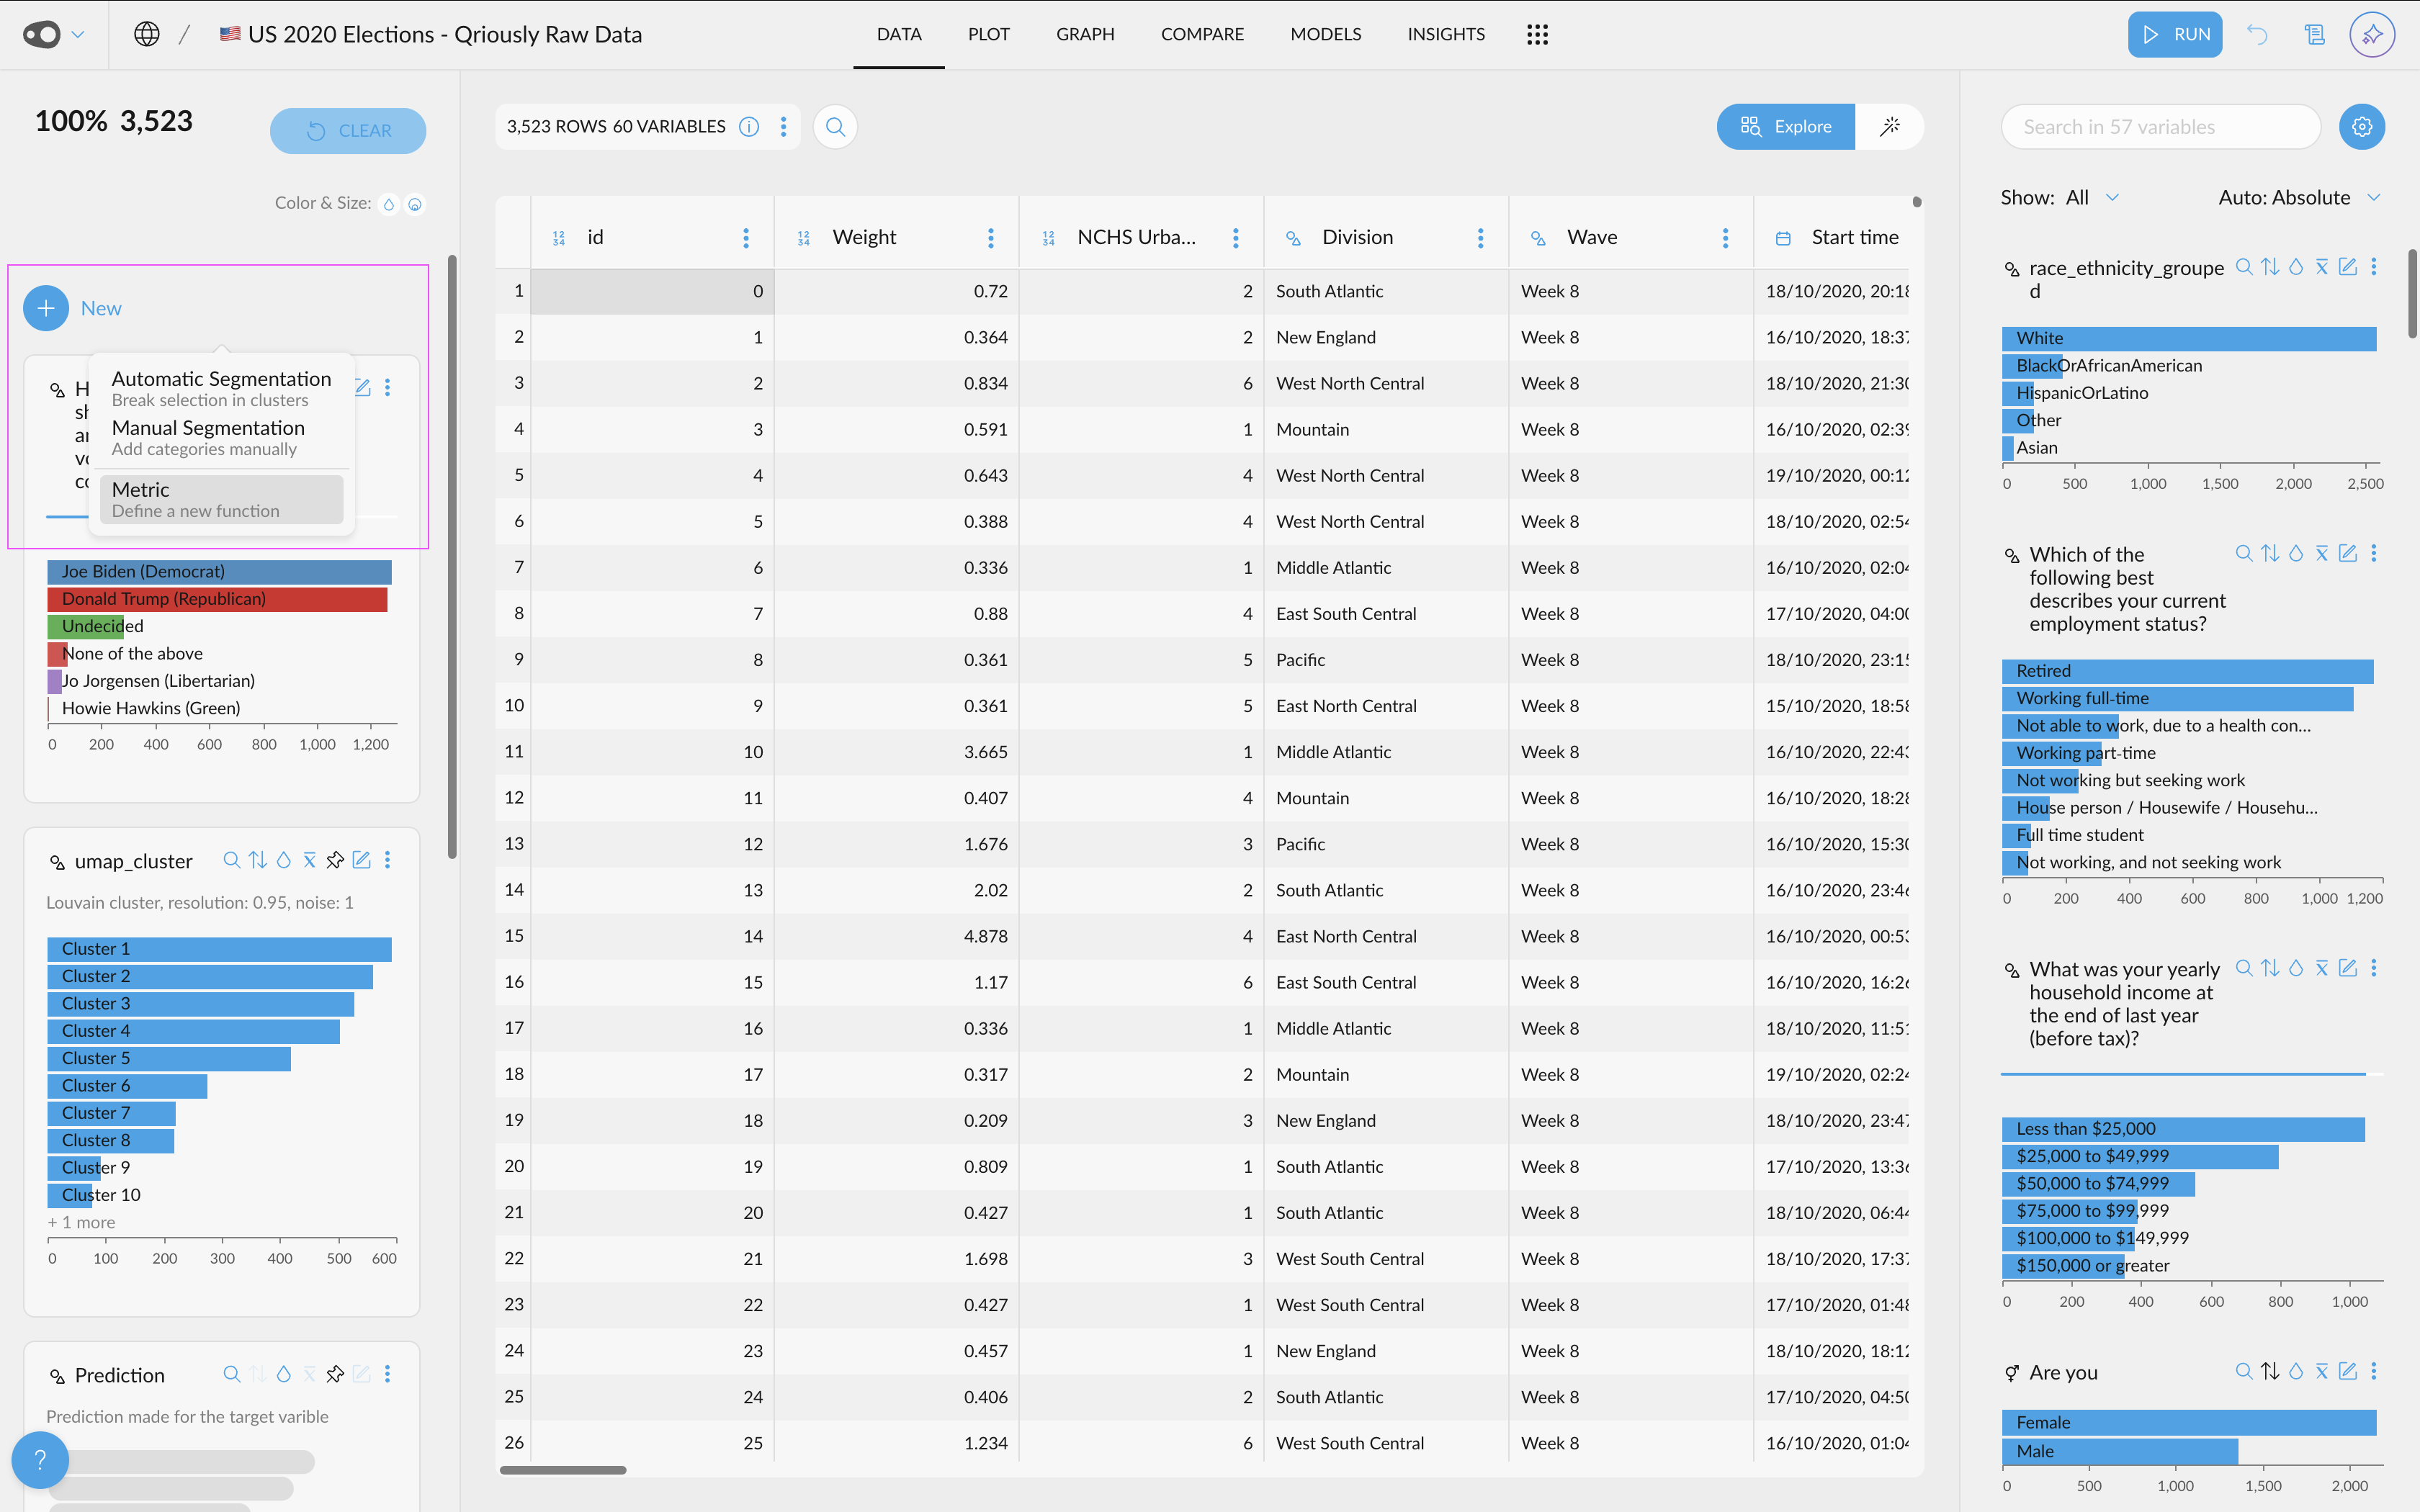
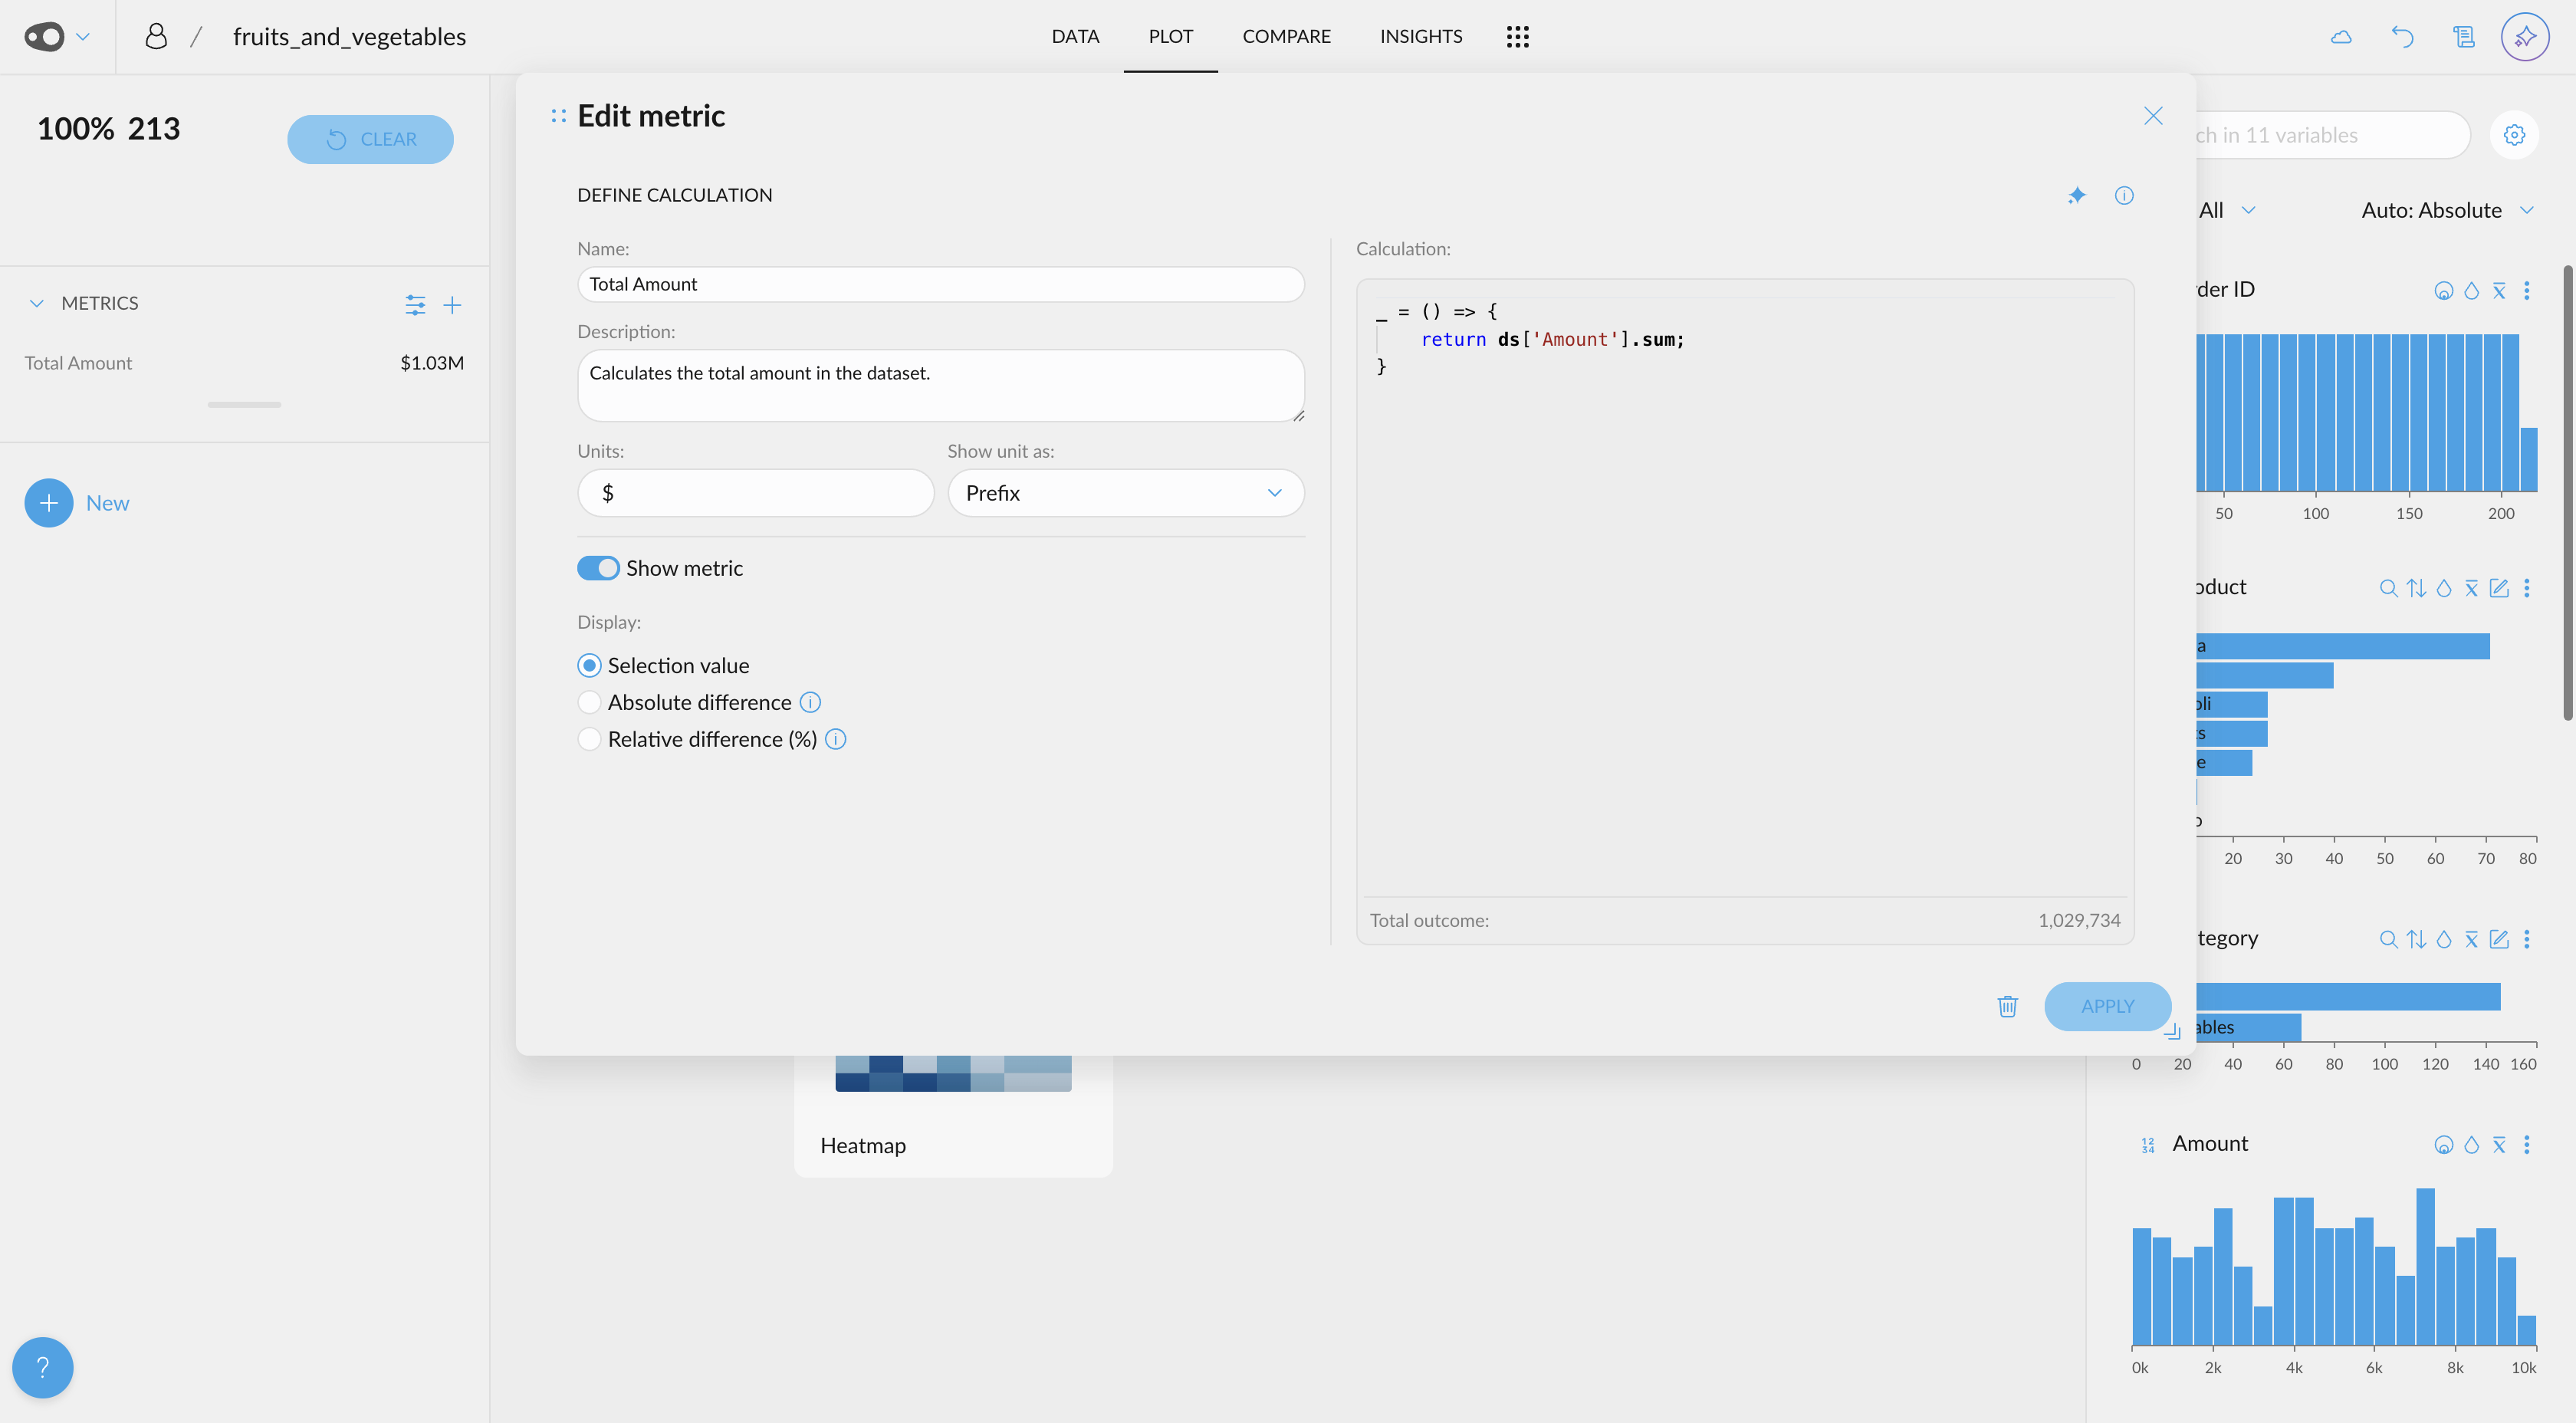
- Add units to metrics. When creating or editing a metric, you can specify a symbol (e.g., $, kg) to display as a prefix or suffix next to the value.
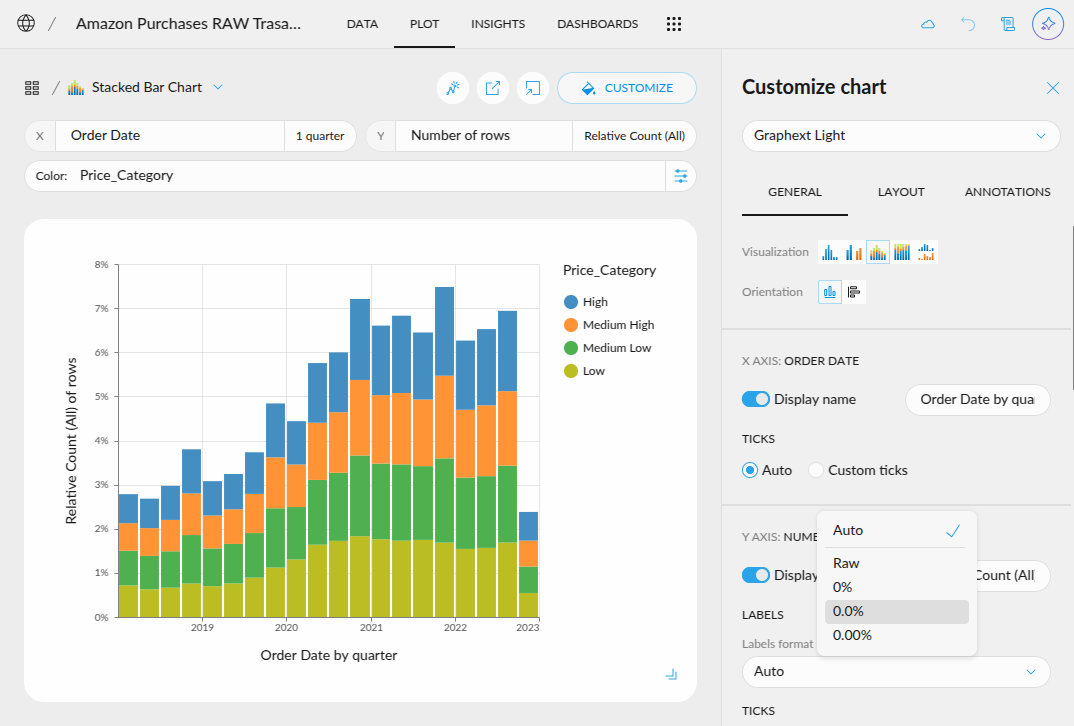
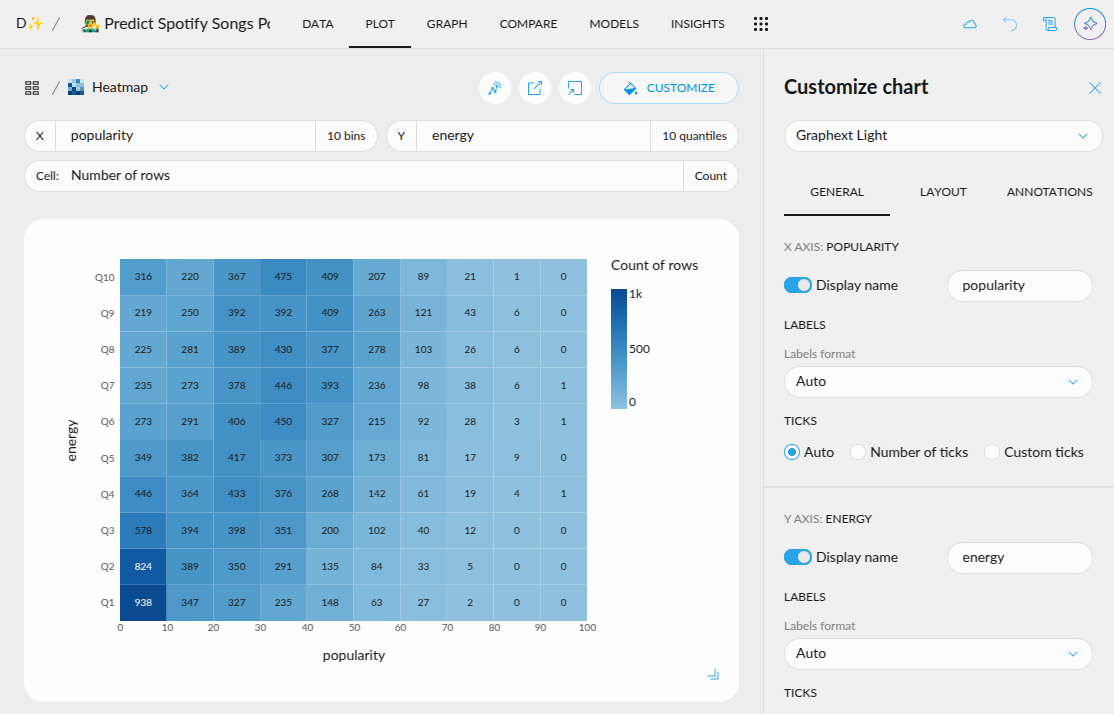
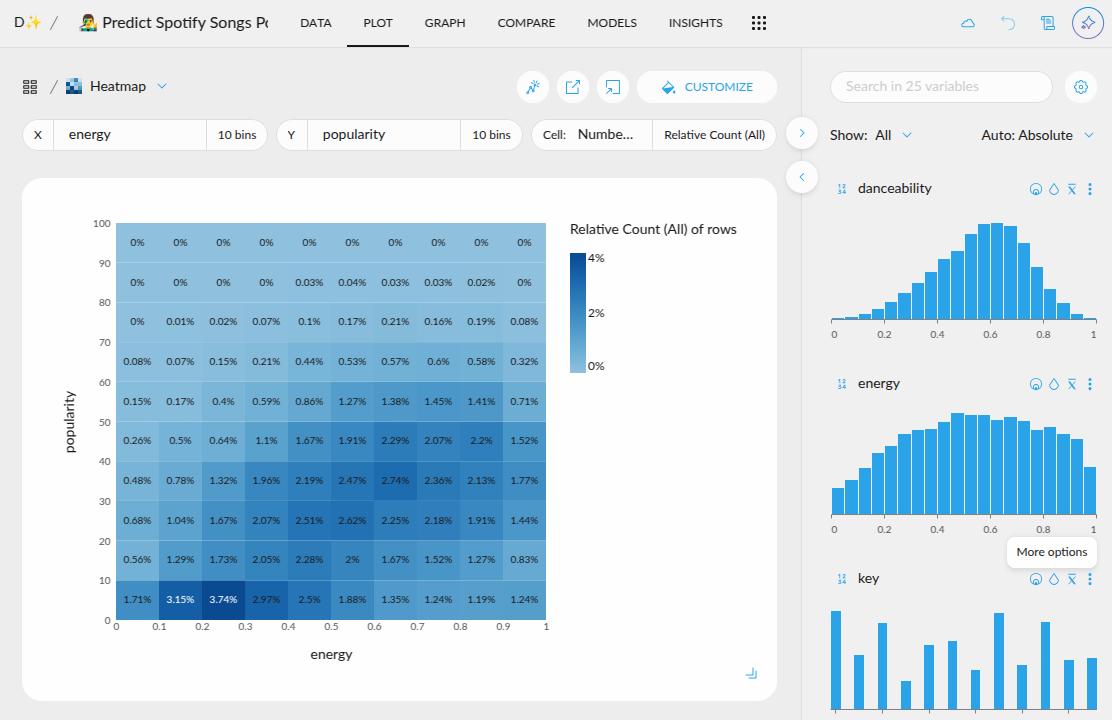
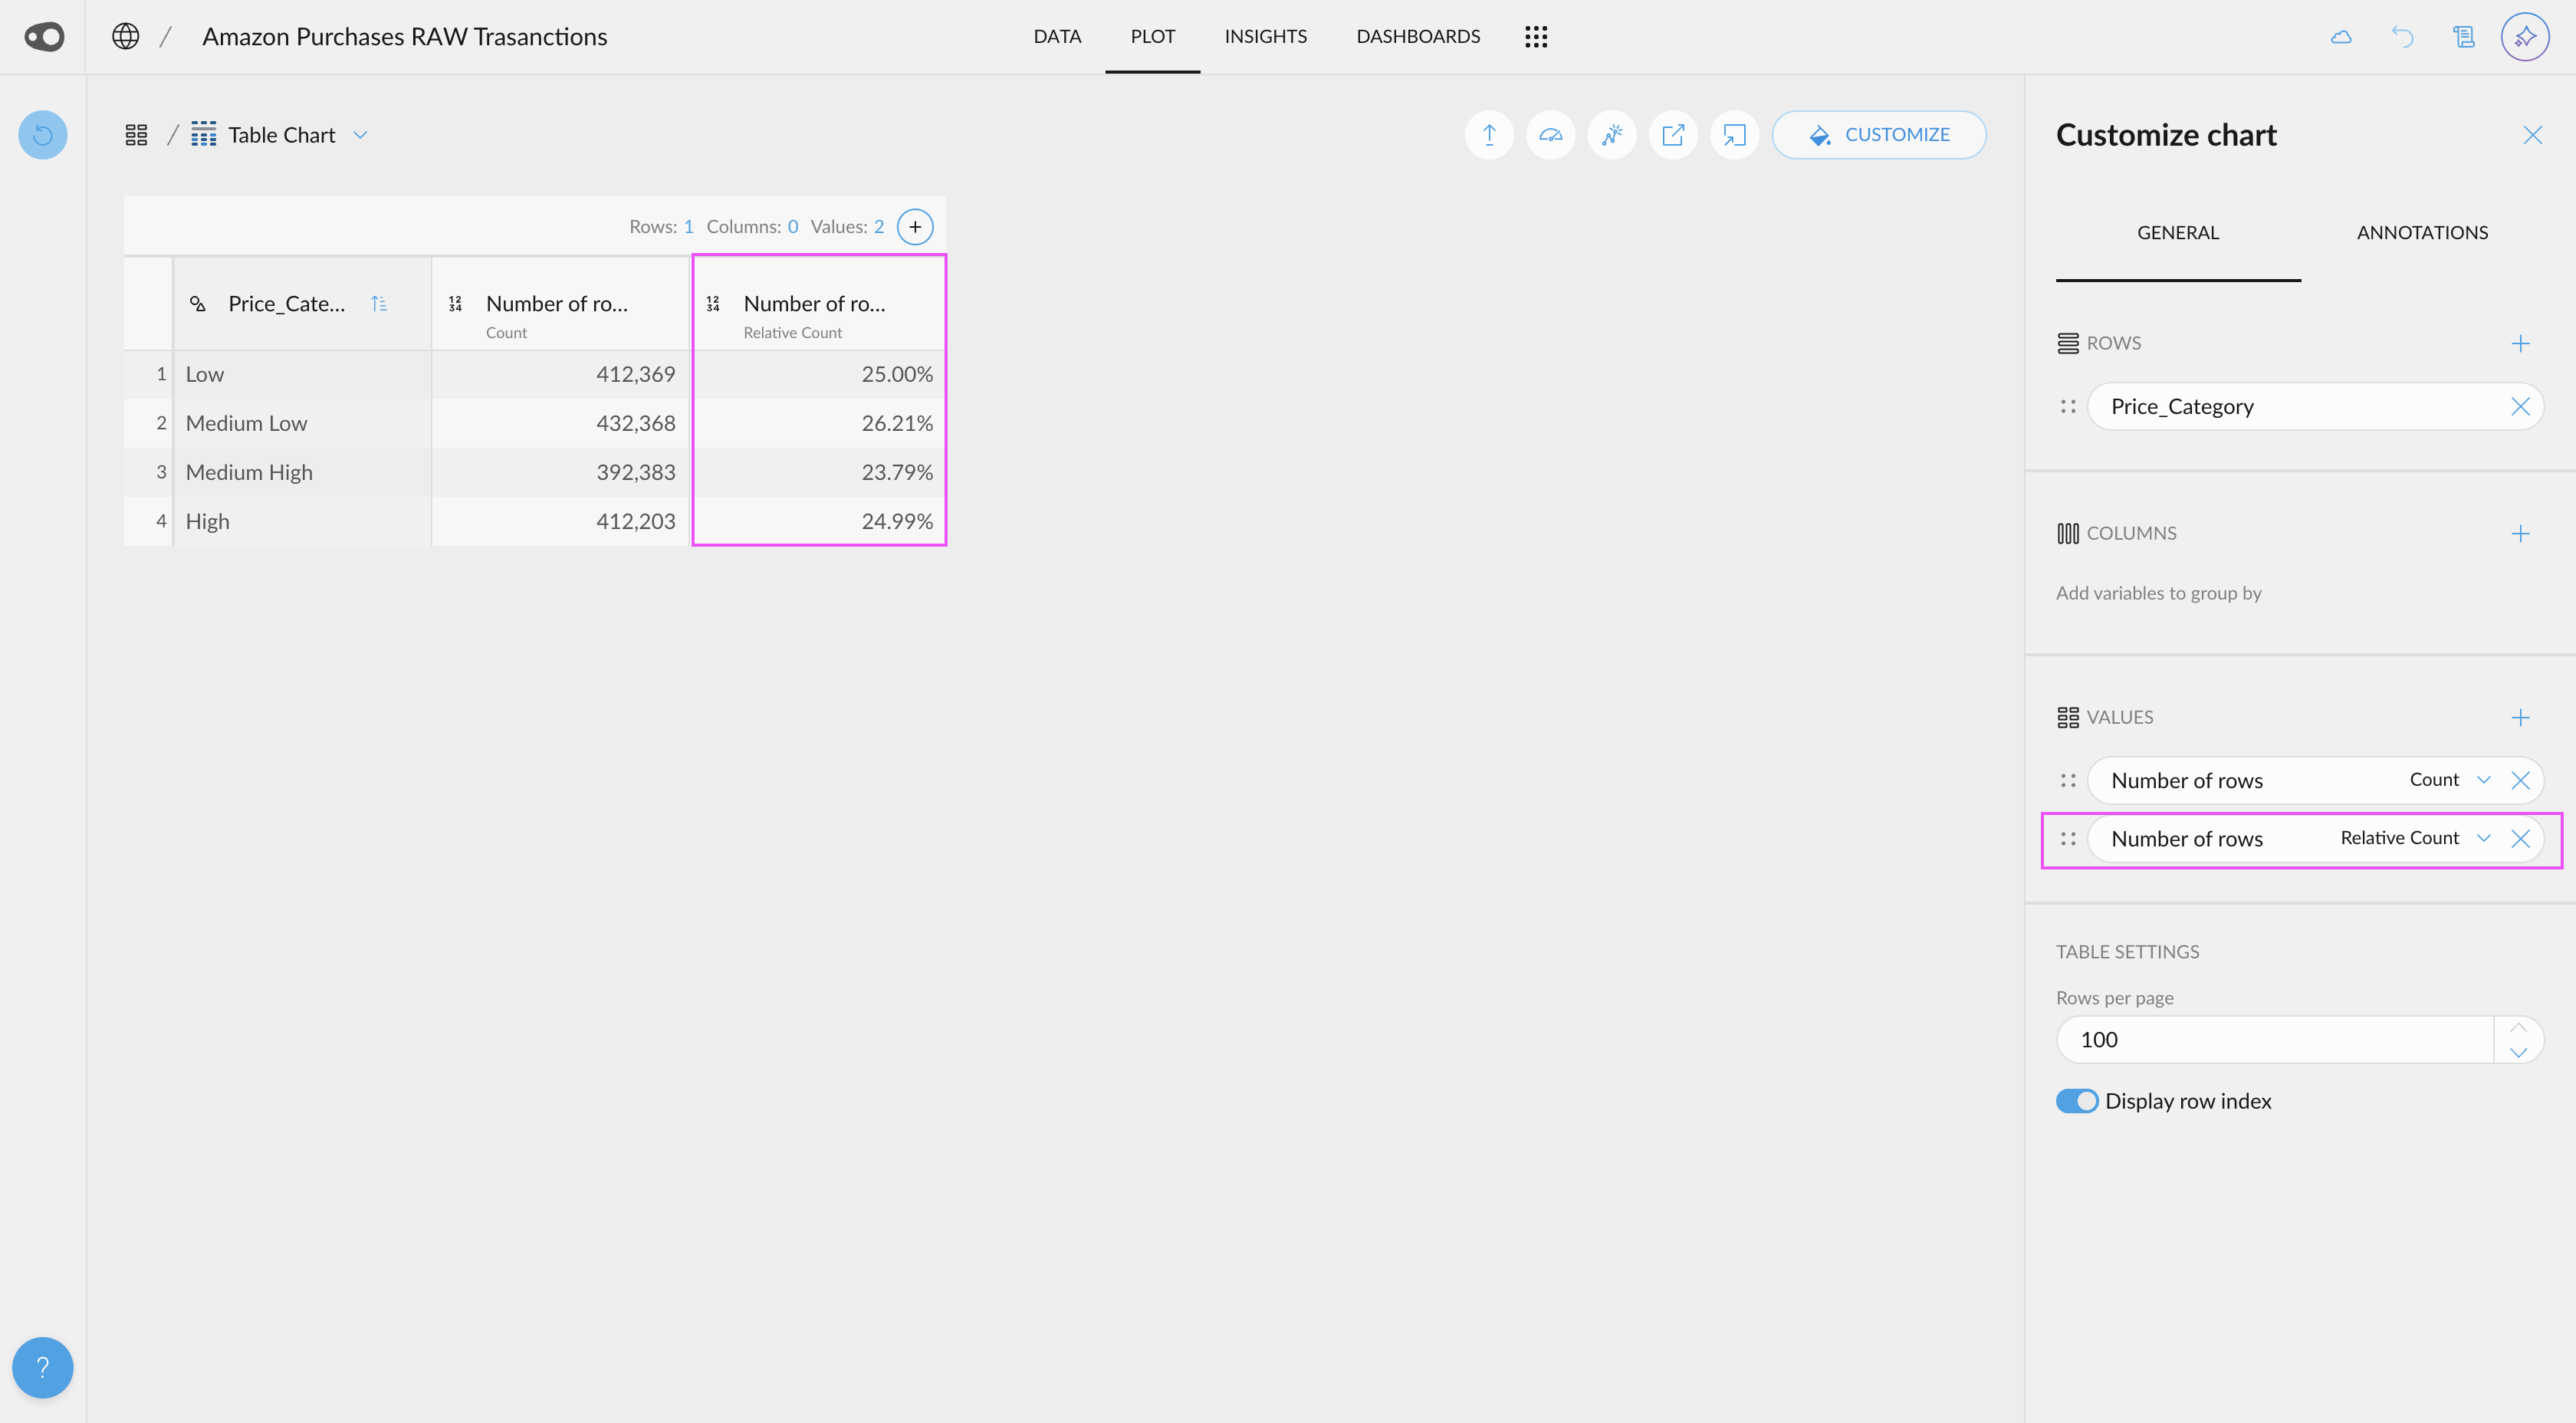
- “Number of rows” has a new aggregation. In the pivot table, you can now use the 'Relative Count' aggregation for the 'Number of Rows' value.
- Filter values in a pivot table. When using a pivot table, you can now apply rules to filter the columns resulting from the aggregation (table values).