January 21, 2025
🌟 New Features
- Add tags with AI: Just upload your dataset, click add tags and our Gen AI will group your variables, putting under the same tags the ones that are from the same “family” e.g. Demographics, Economic, Usage metrics, etc
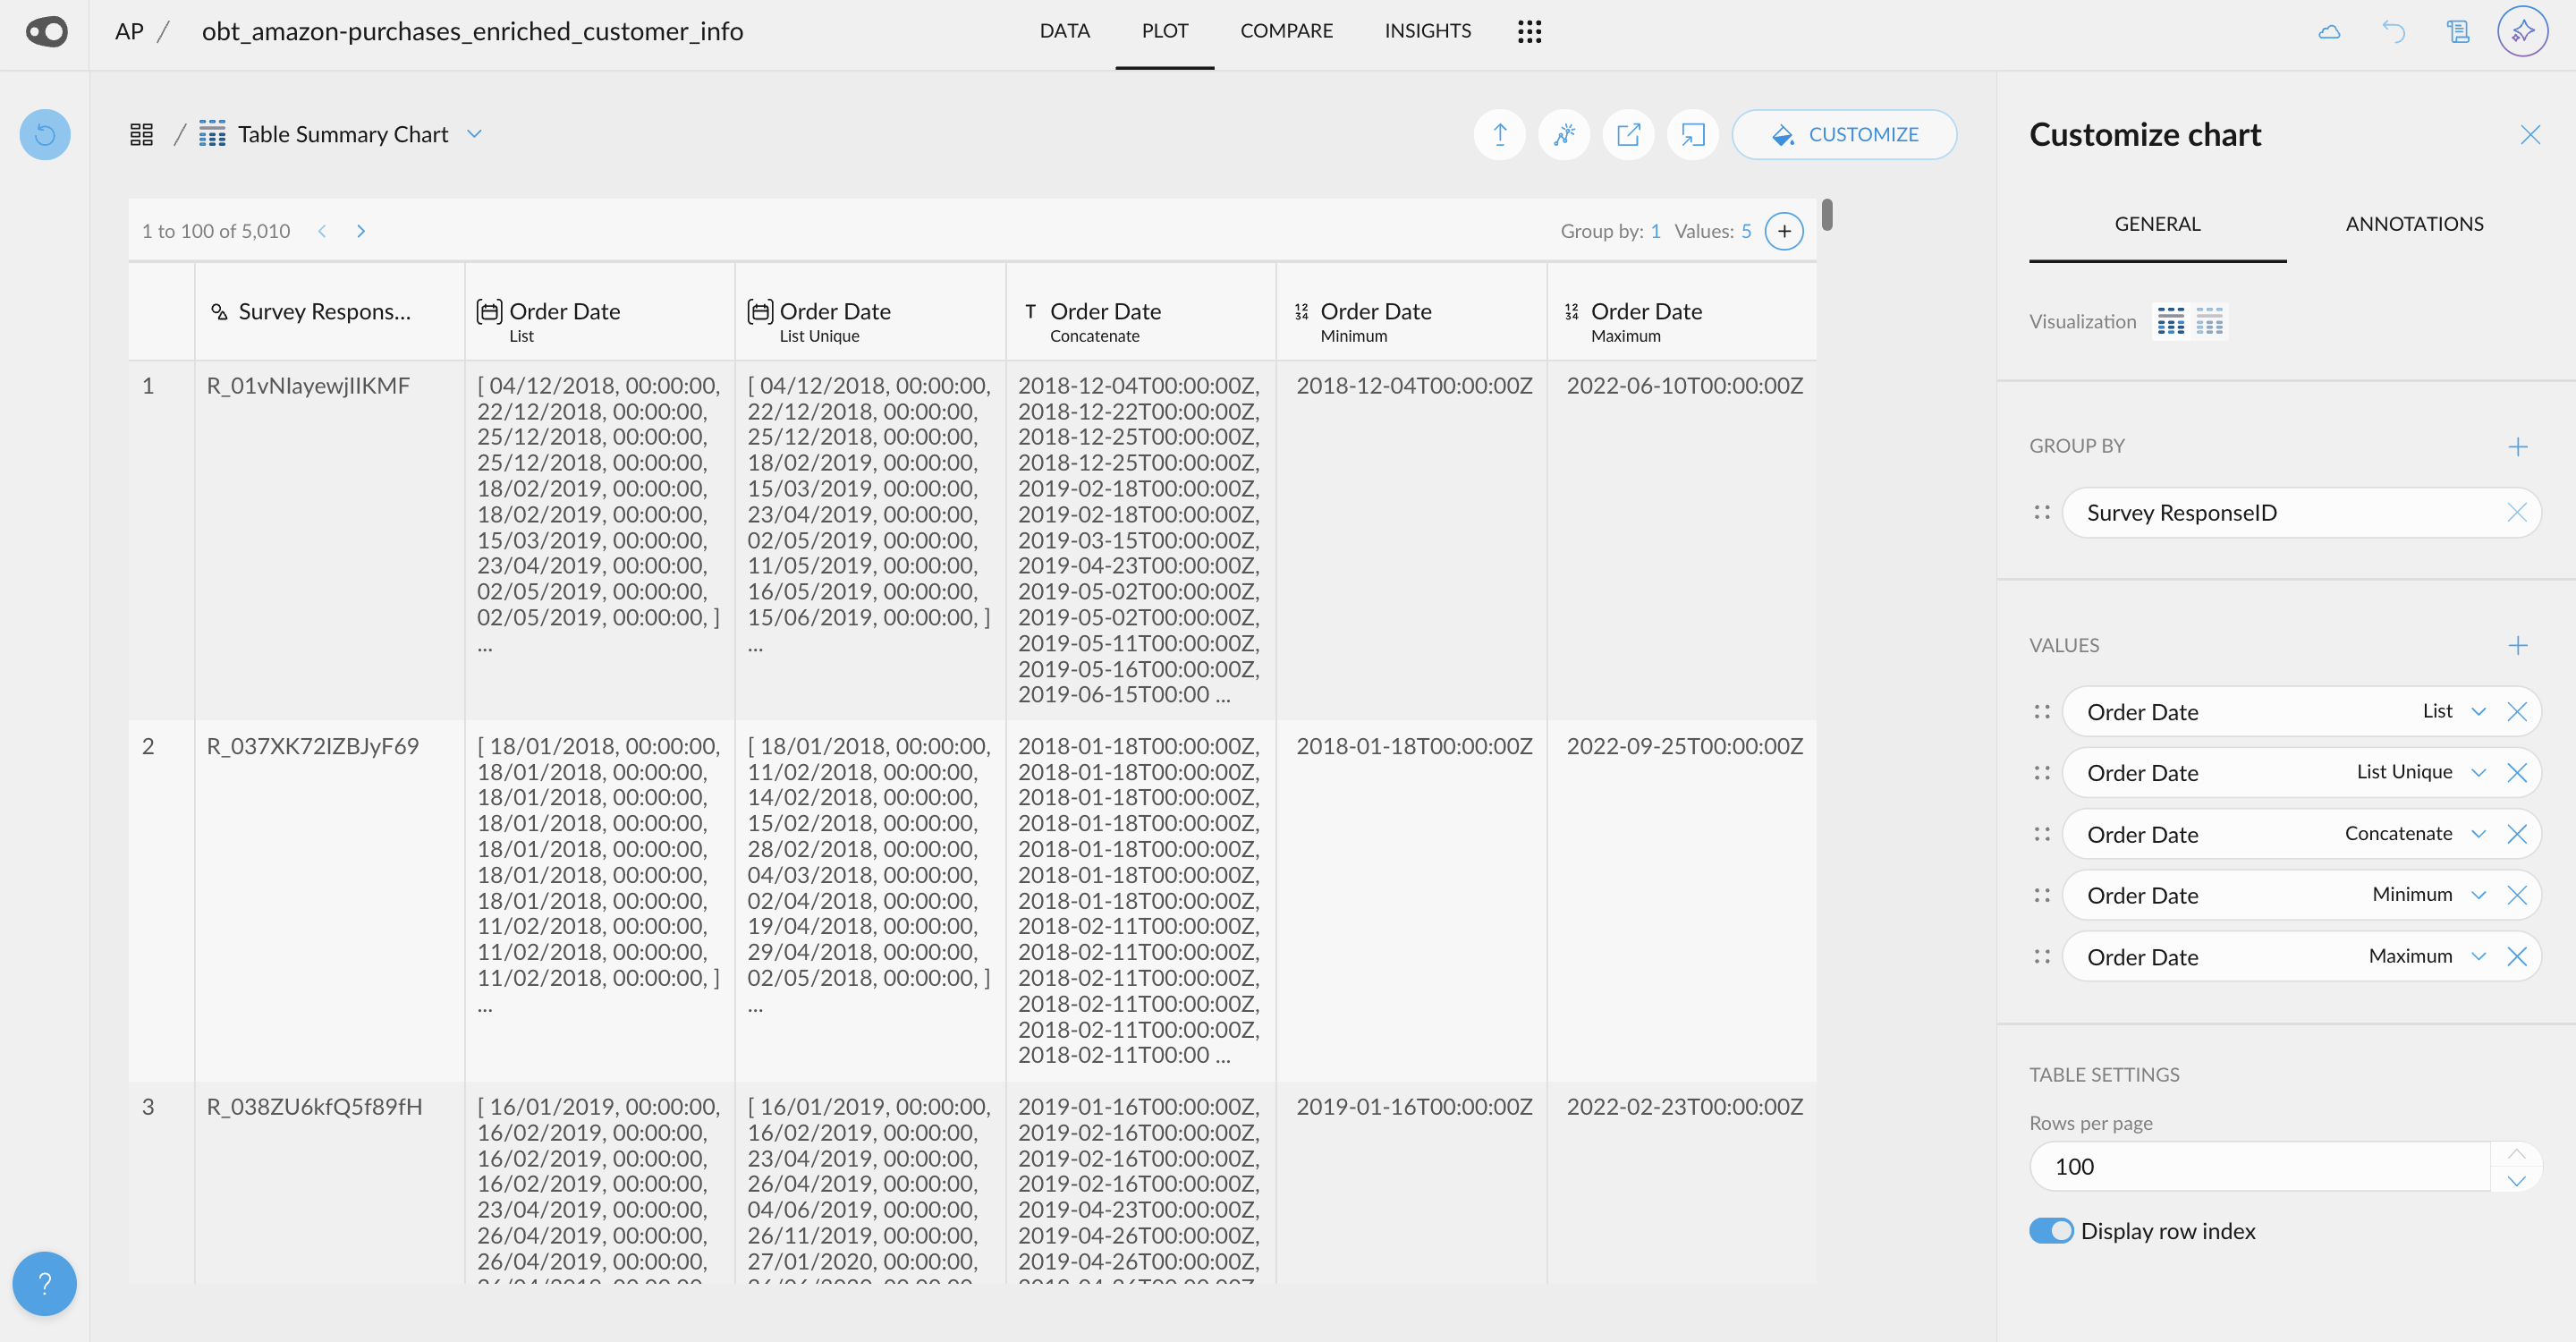
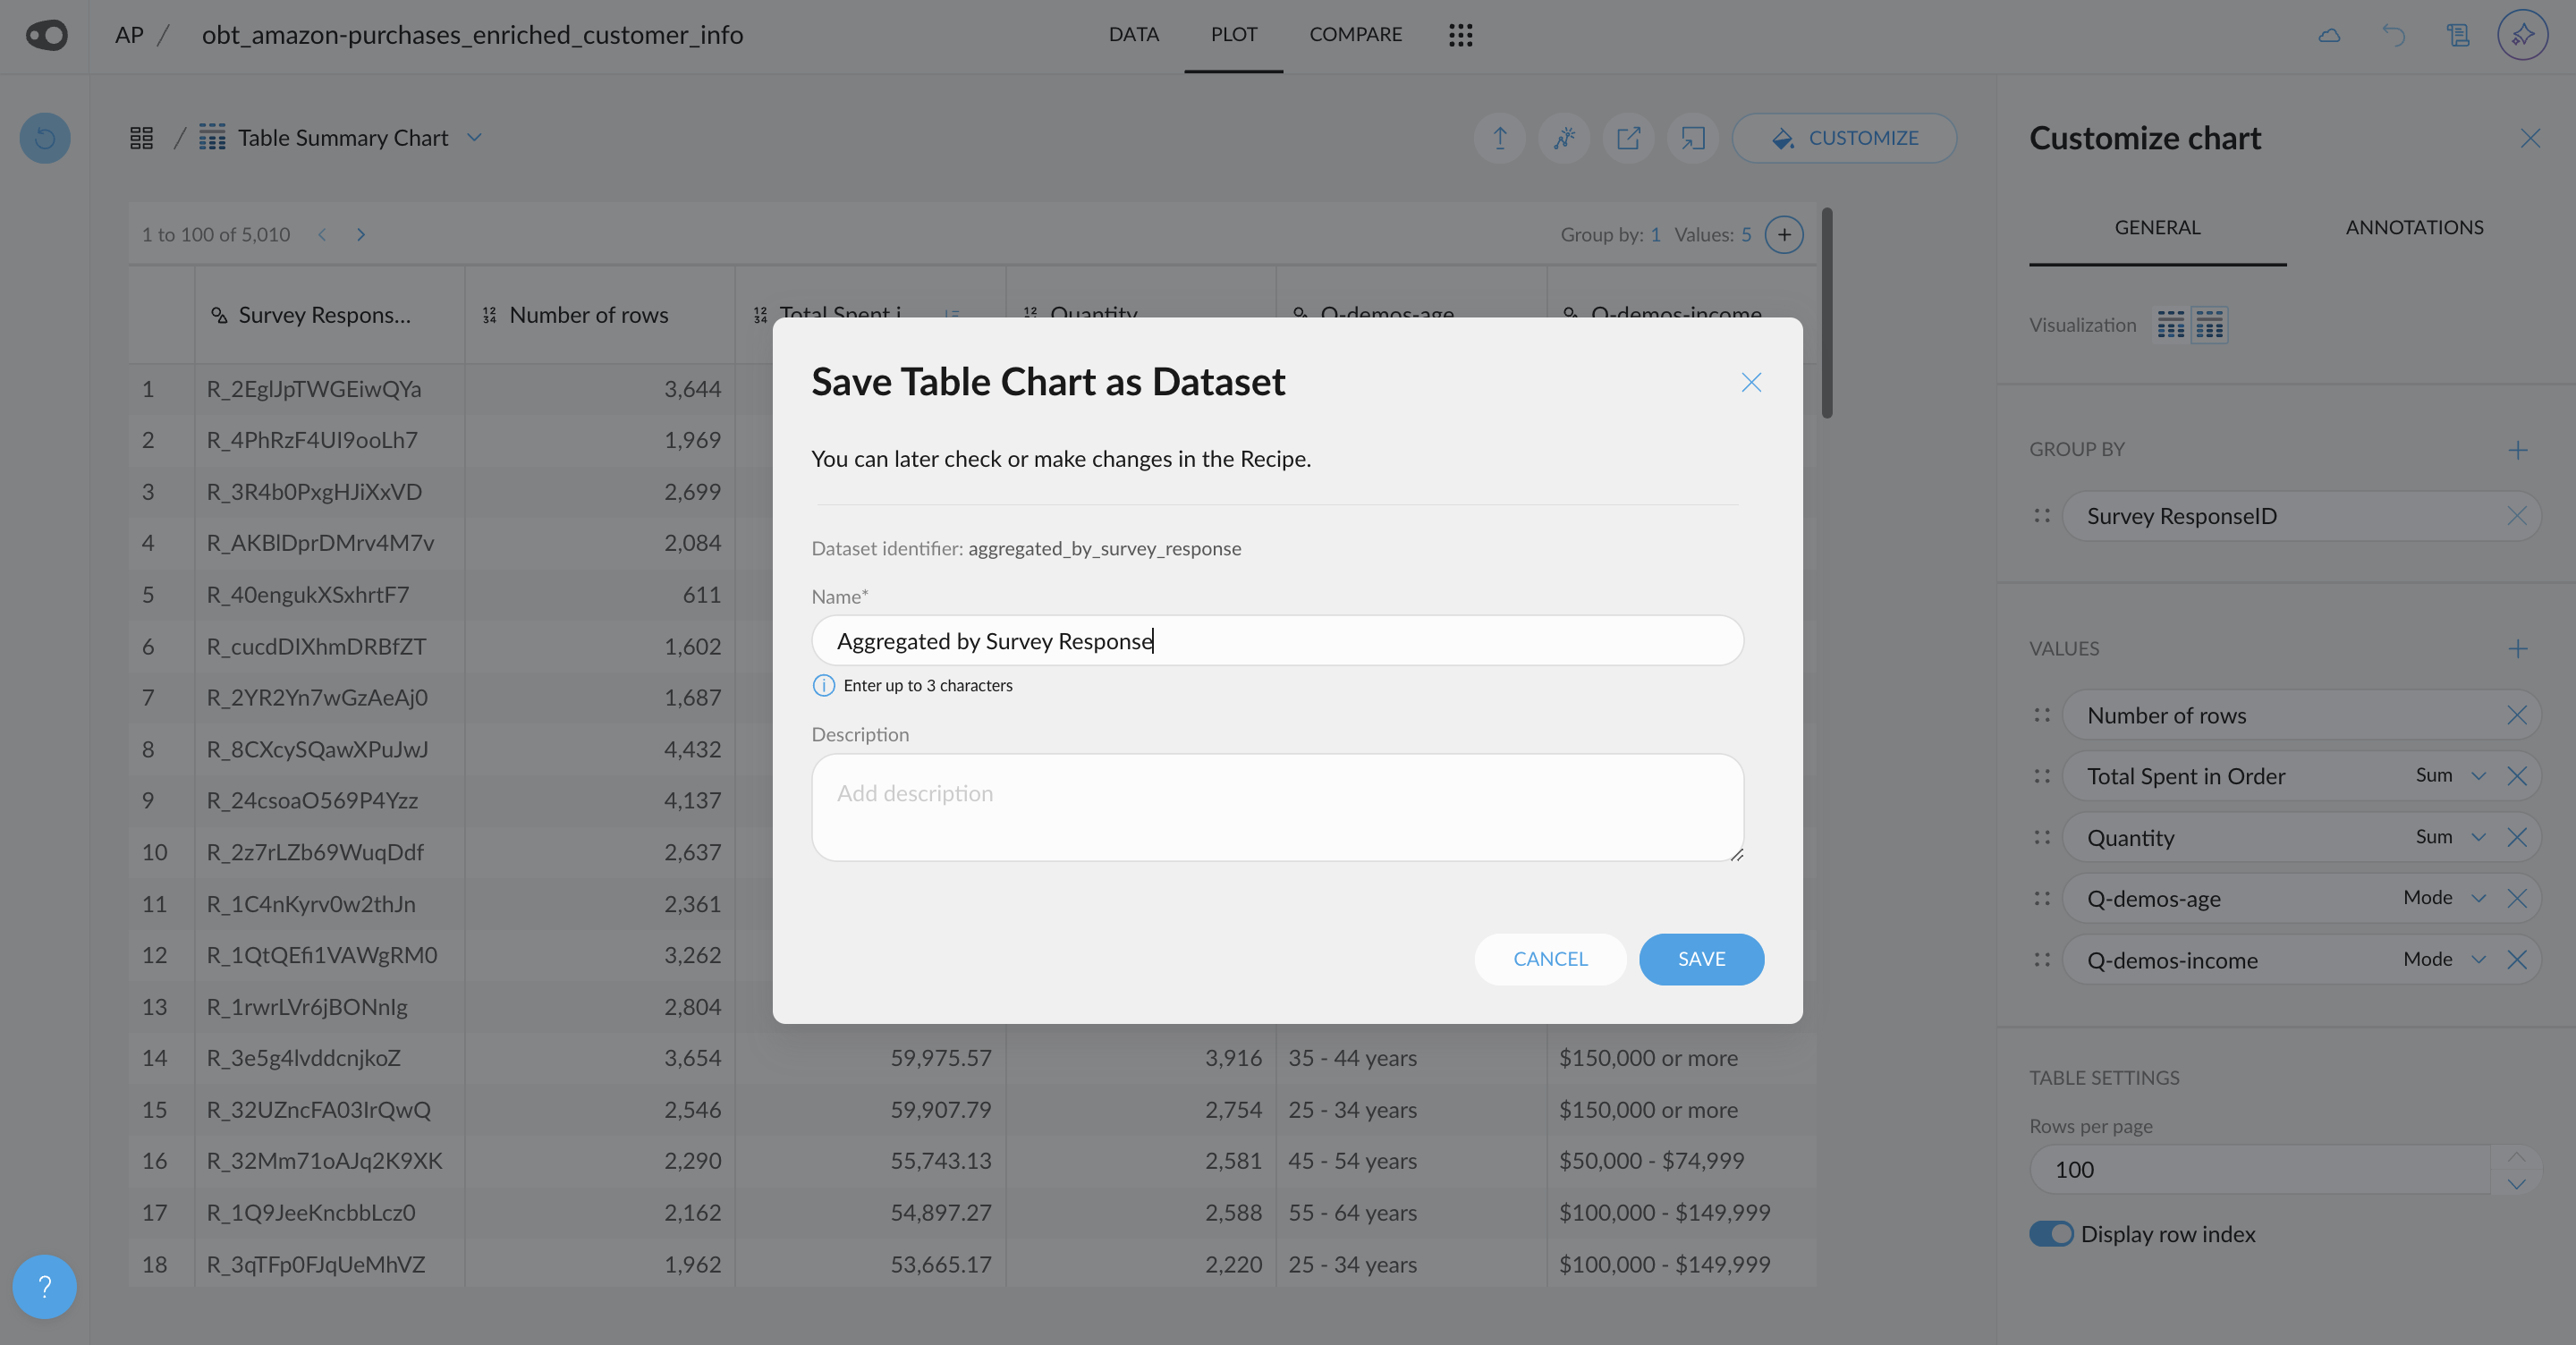
- Columns in the Table Chart and Table Summary Chart can now be renamed! Plus, you can hide the subtitle to keep things clean and skip displaying details like aggregation (e.g., "Value Count") or date discretization (e.g., "1 day")

- Metrics Manager: Now you can view all your metrics in a single modal, making editing and organizing them easier than ever!

- Use categorical ordinal variables in more charts: Allow to use ordinal categorical variables in X axis for Line & Area charts

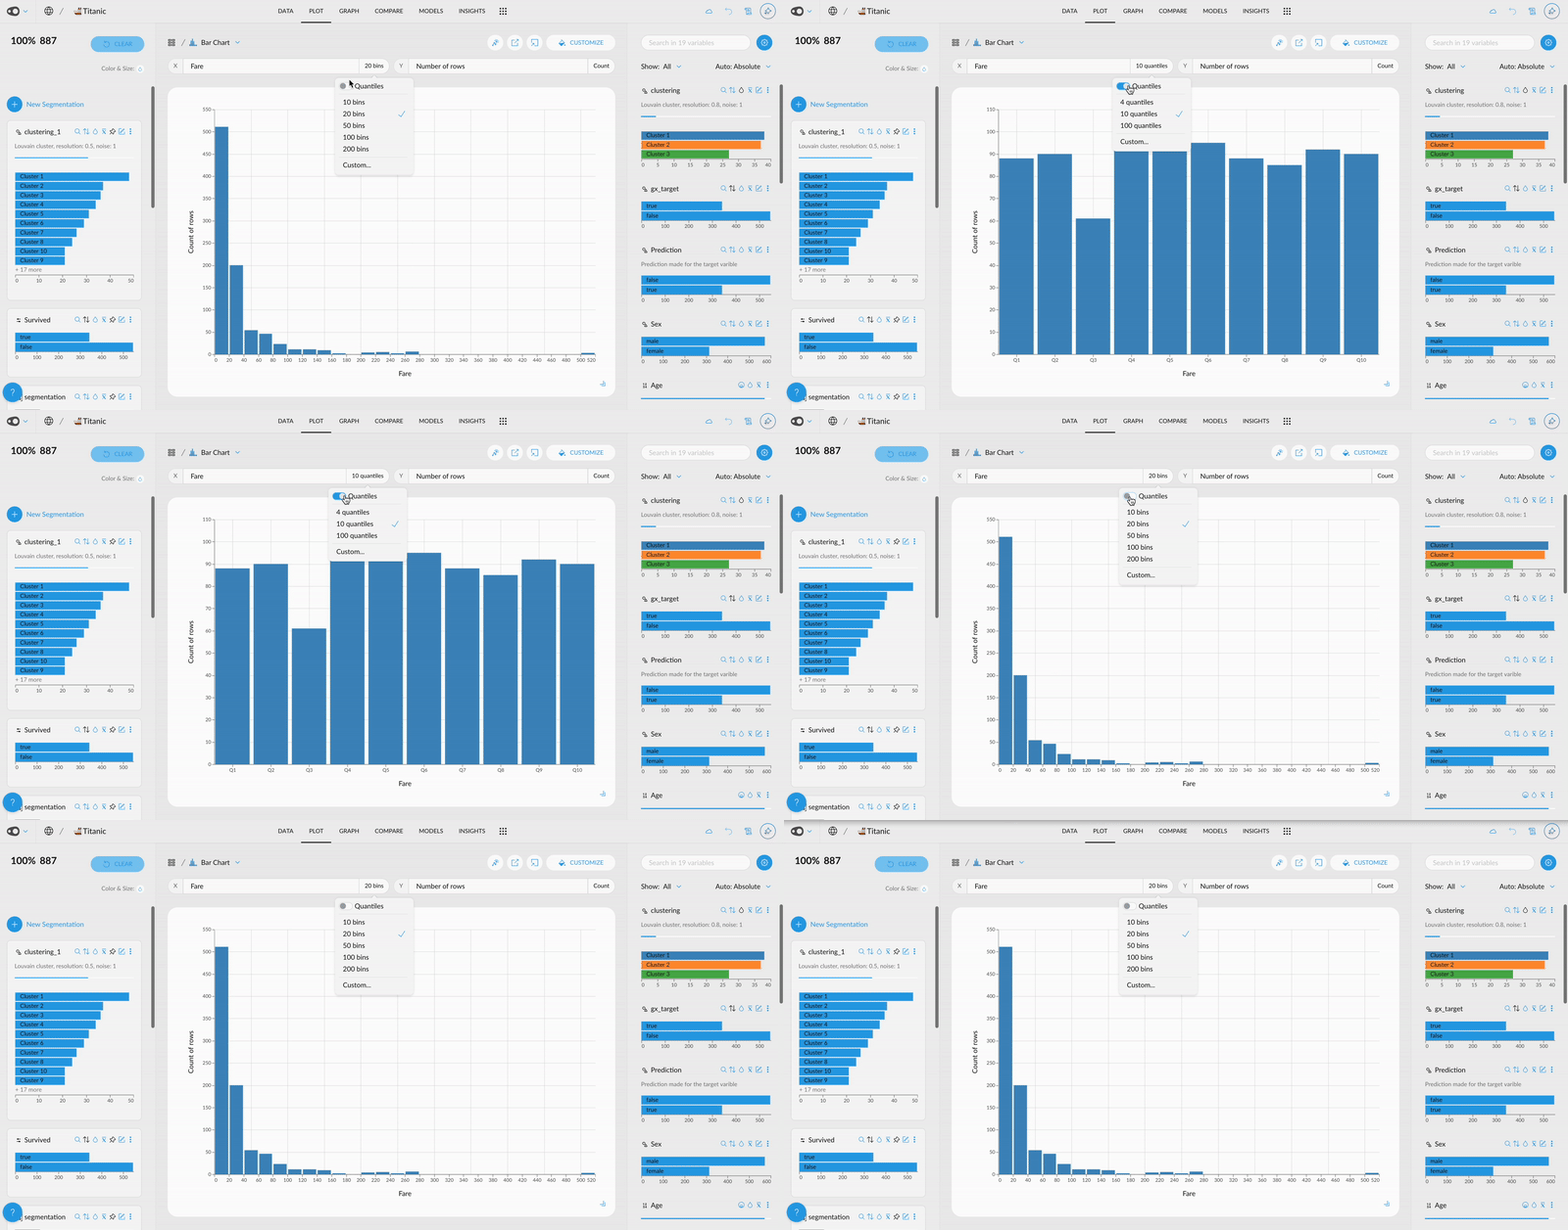
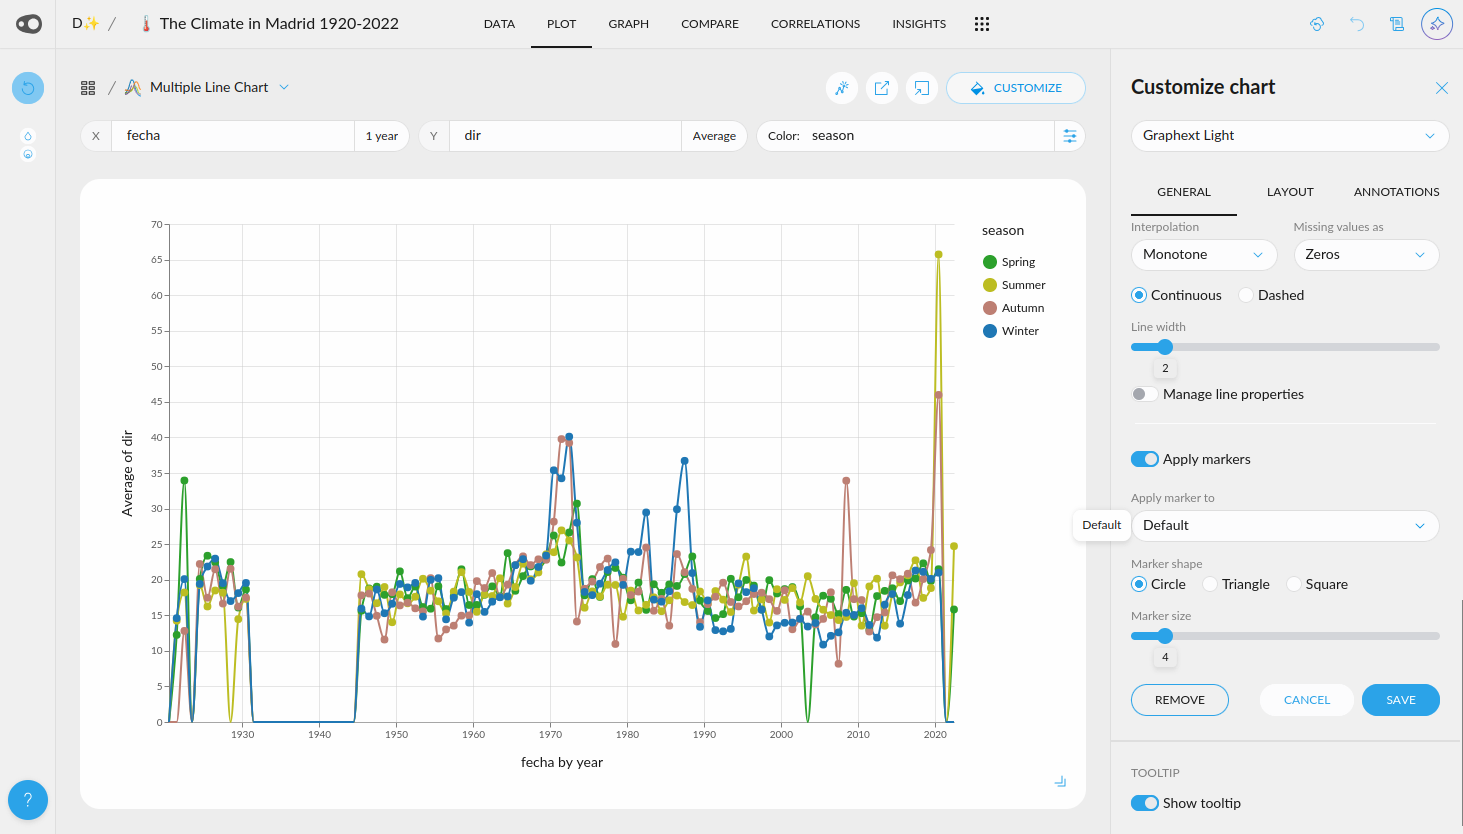
- Labels Rotation: Allow to configure X axis labels rotation for any plot chart. Now X axis labels for categorical variables are rotated if there is not enought space for each bin. Also we can modify this default behaviour by using rotate or horizontal modes

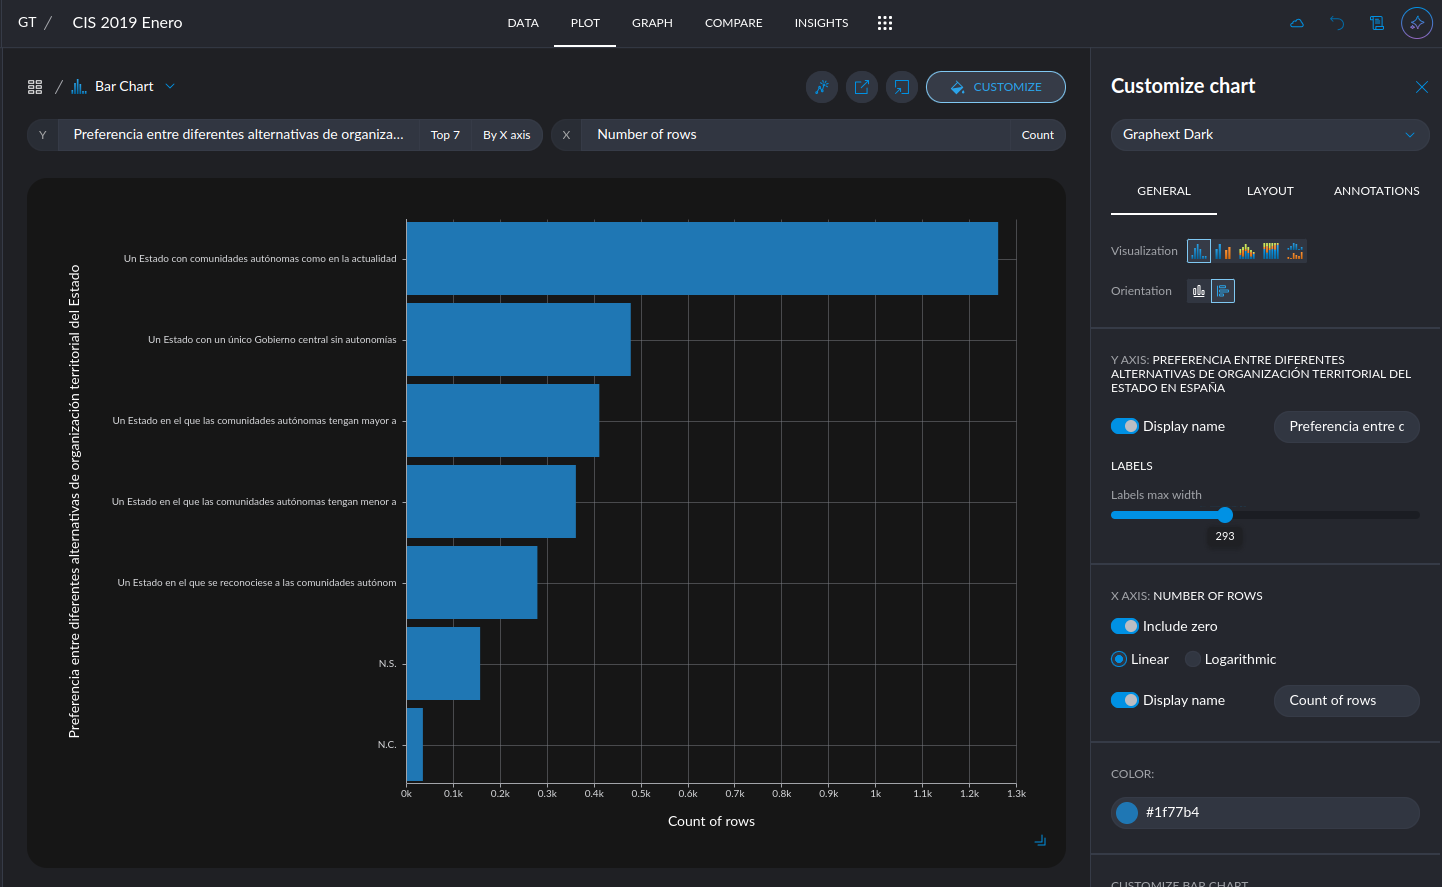
- Axes label width configuration: Allow to control the maximum width of labels

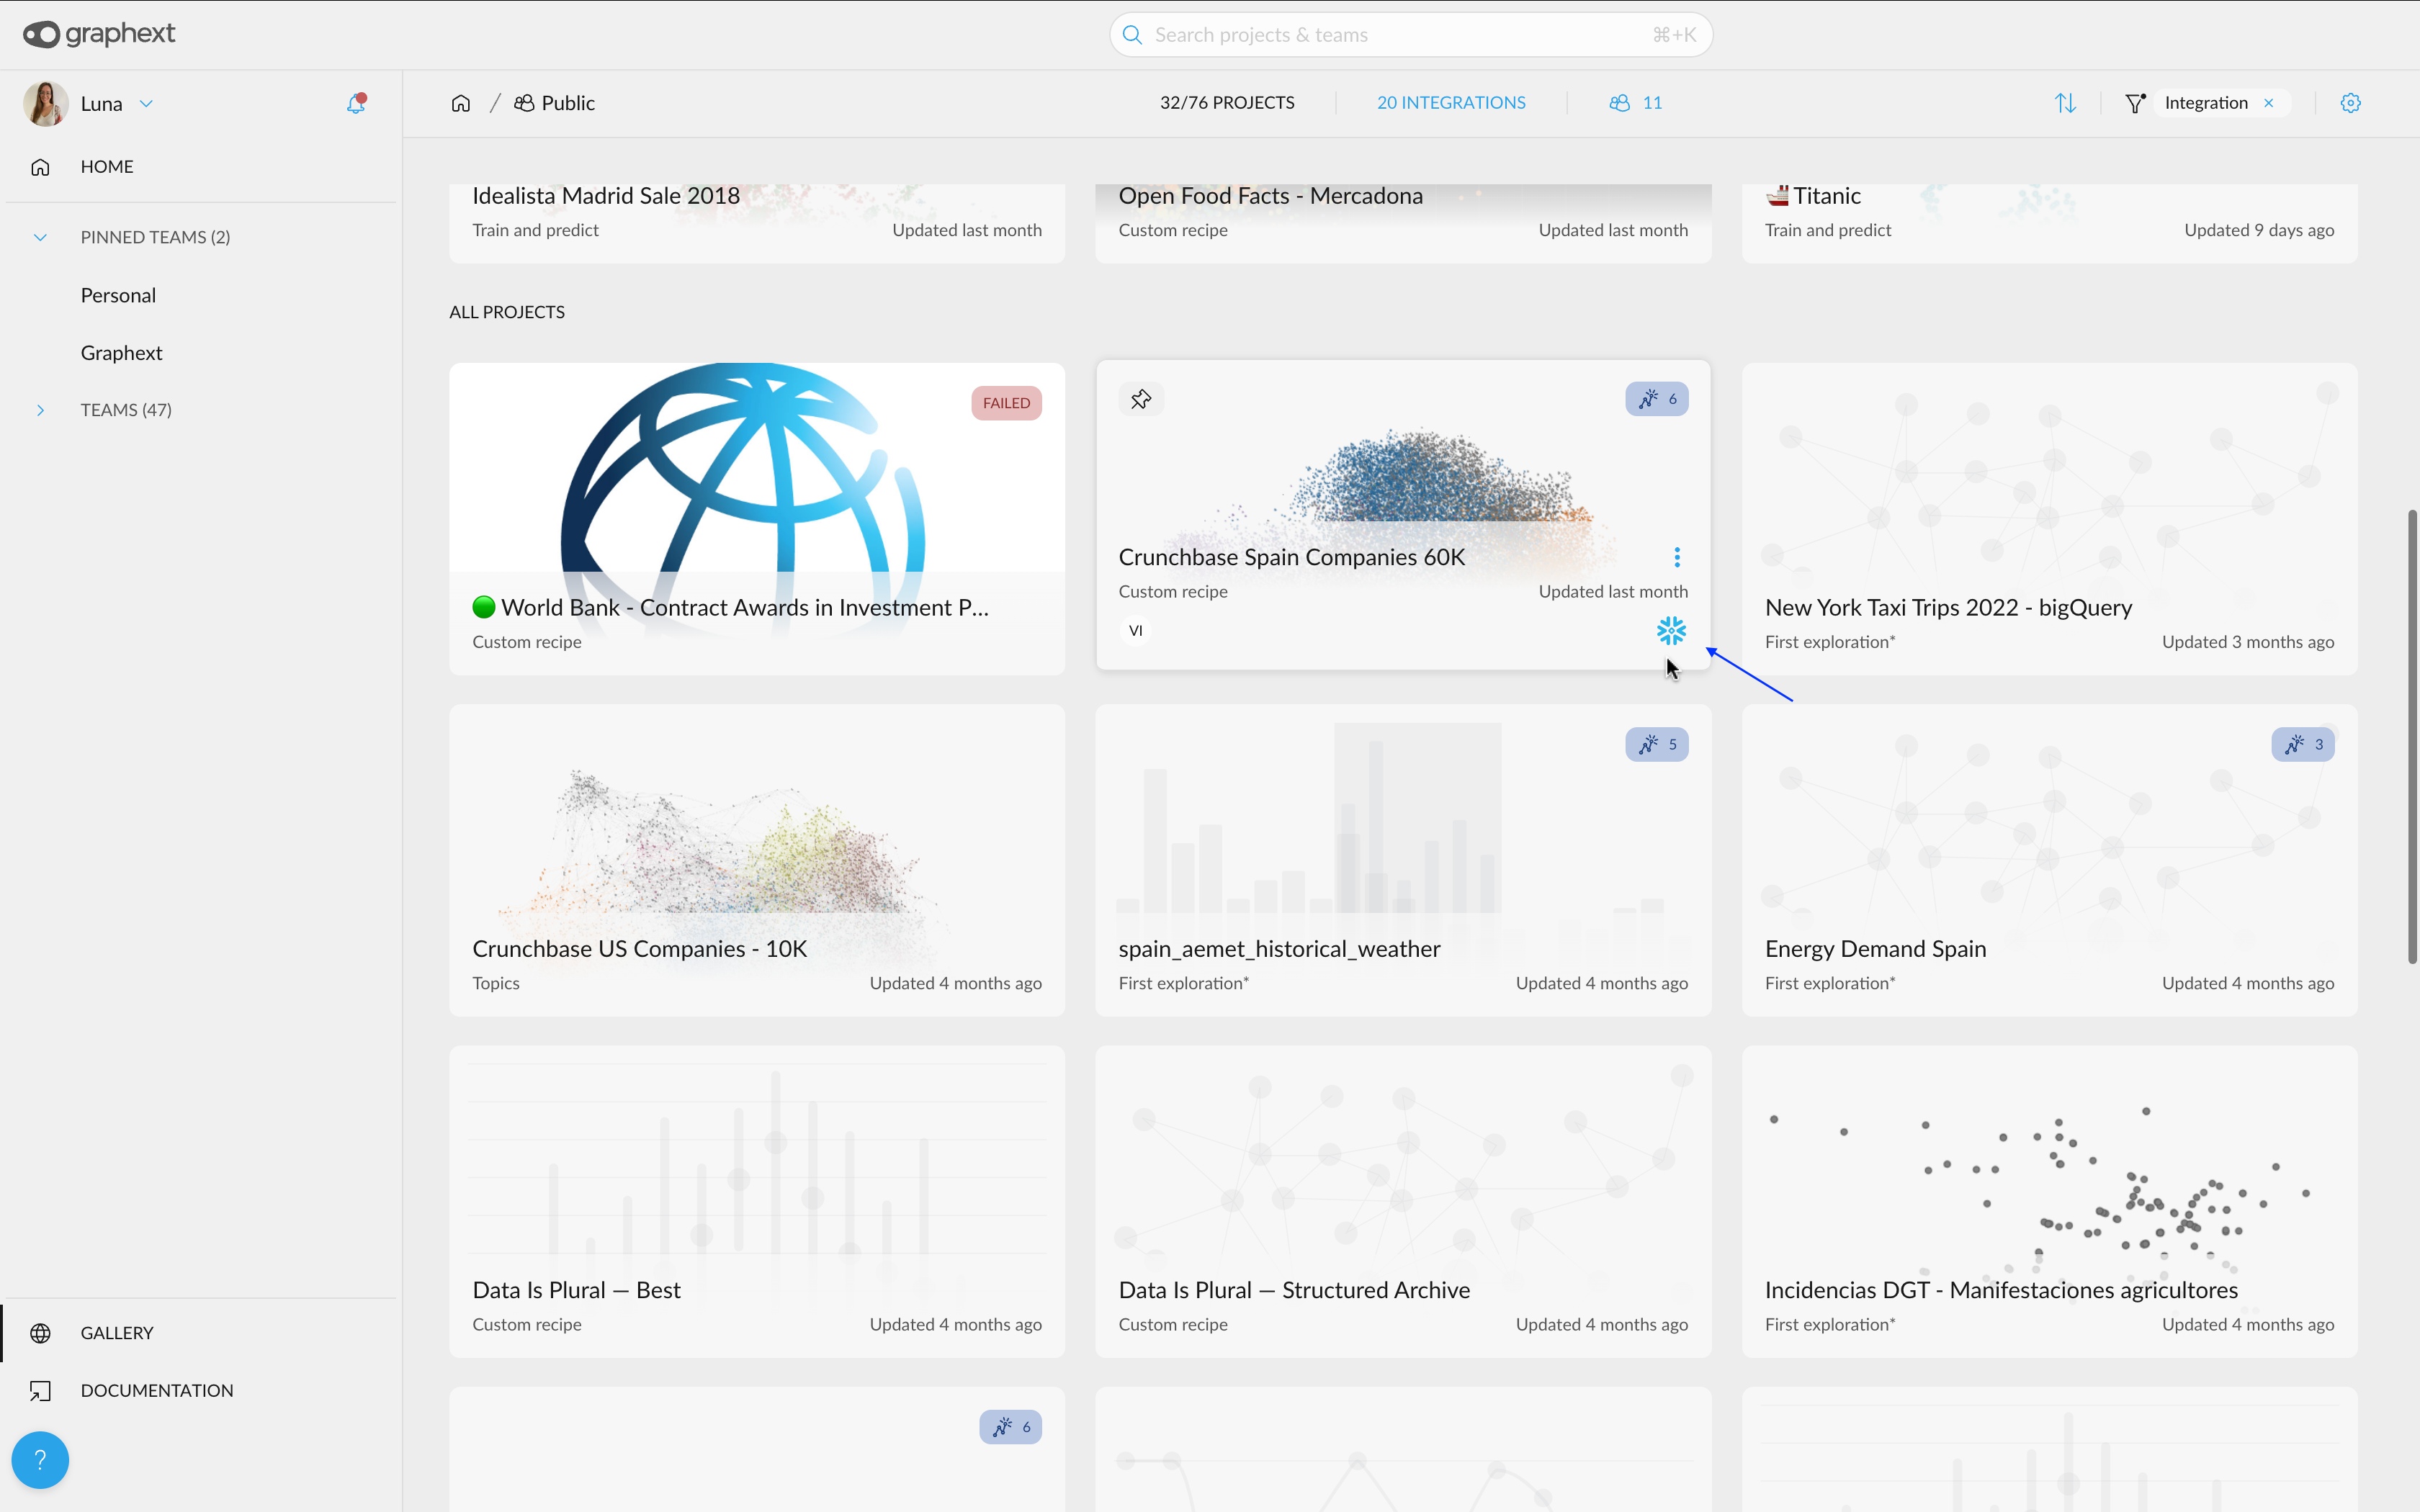
- Find the integration connected to your project: To help identify the integration from which a project was created, we've added a shortcut to the integration icon. Simply click on it on the project's card, and you'll be able to edit the associated integration.
- Edit the query associated to a project in a seamless way: To simplify finding the integration linked to a project, we've added a shortcut within the project steps. Just click on it, and you'll be instantly redirected to the Hall, where you can edit the integration.

🎨 UI Updates
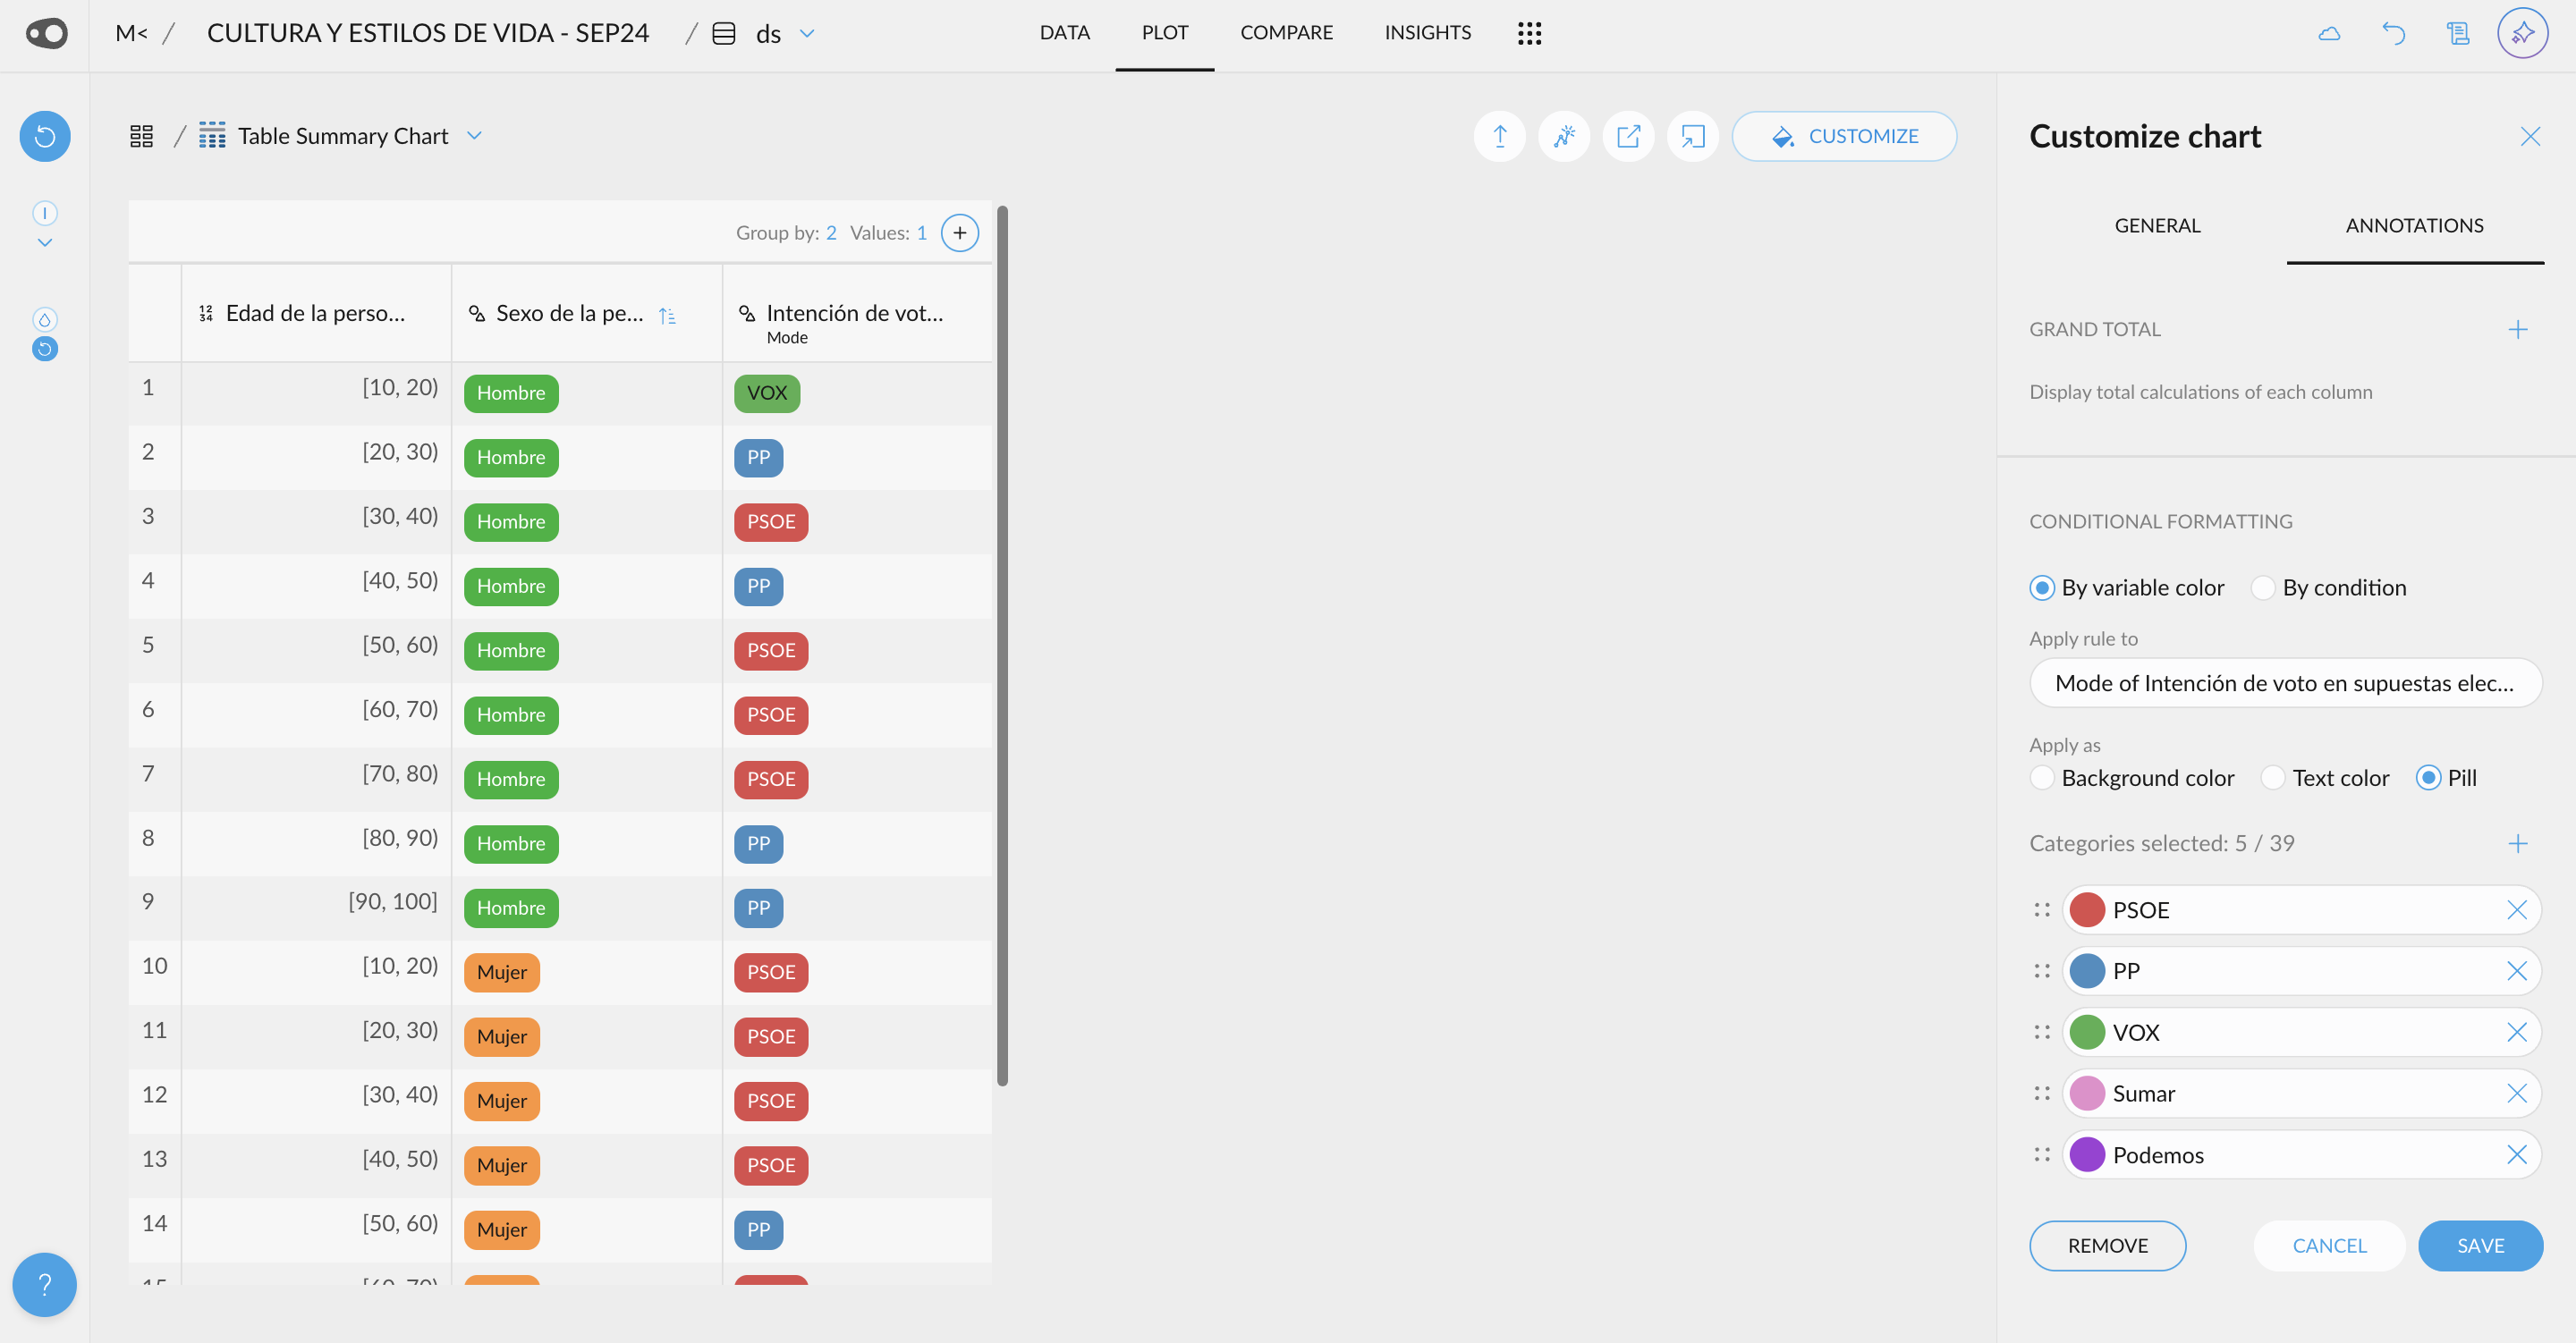
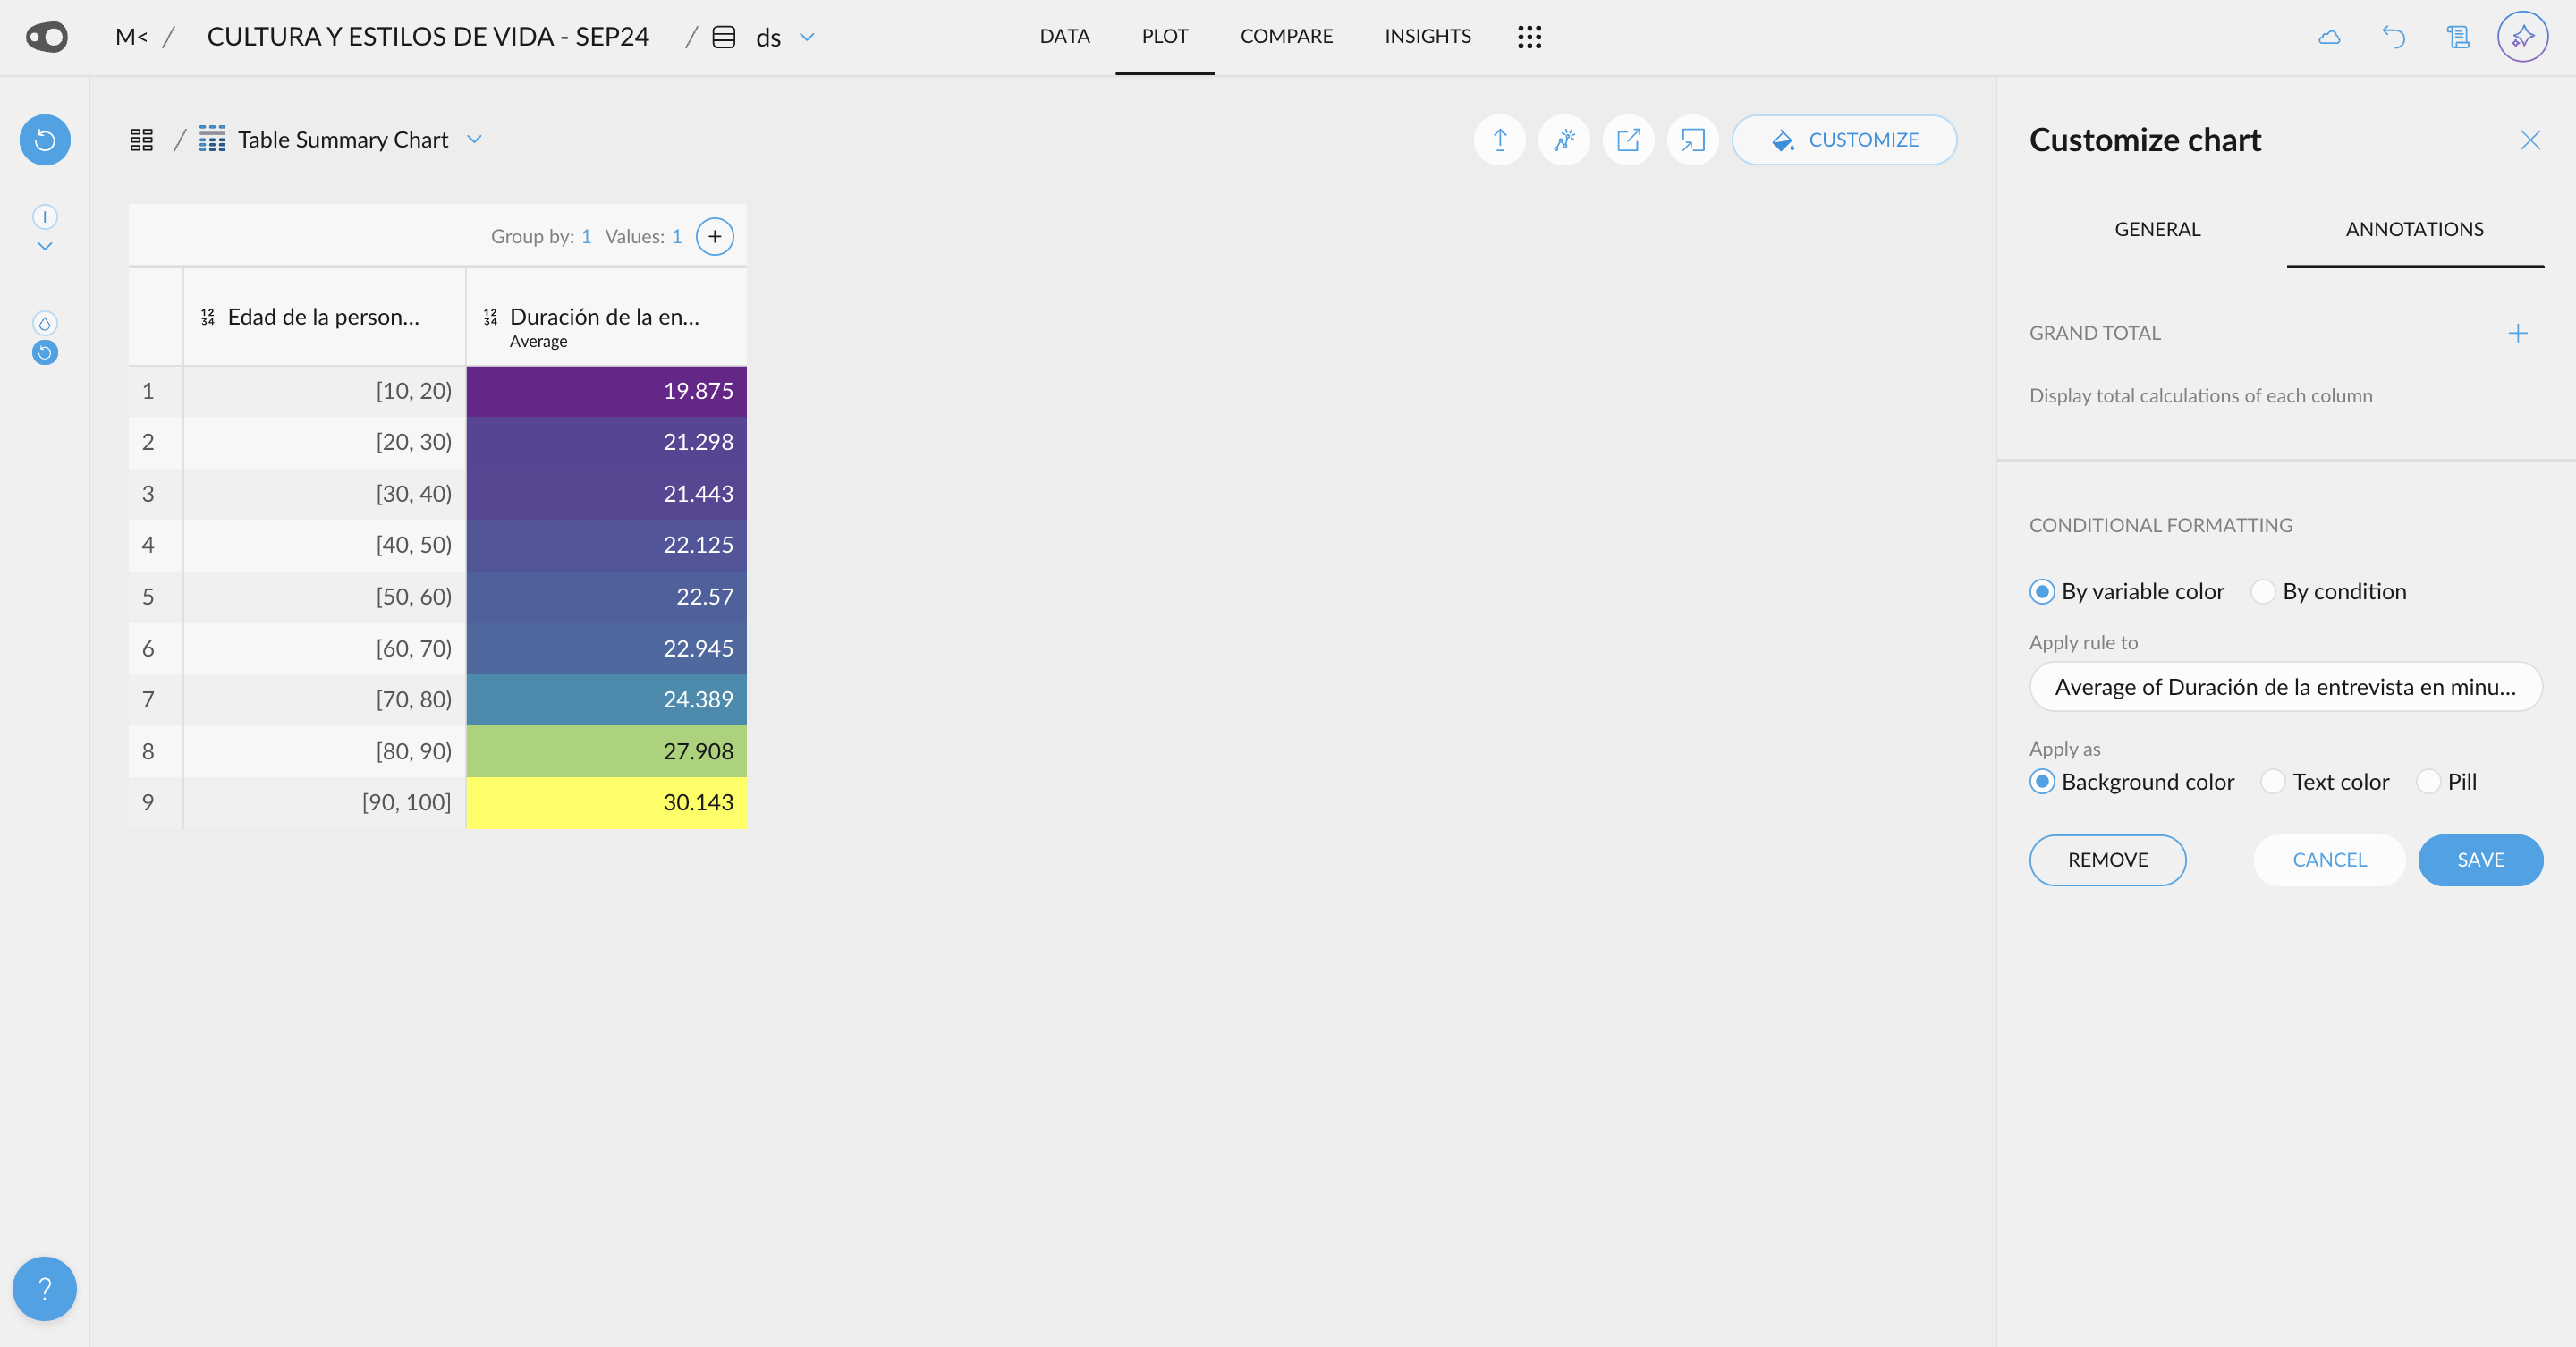
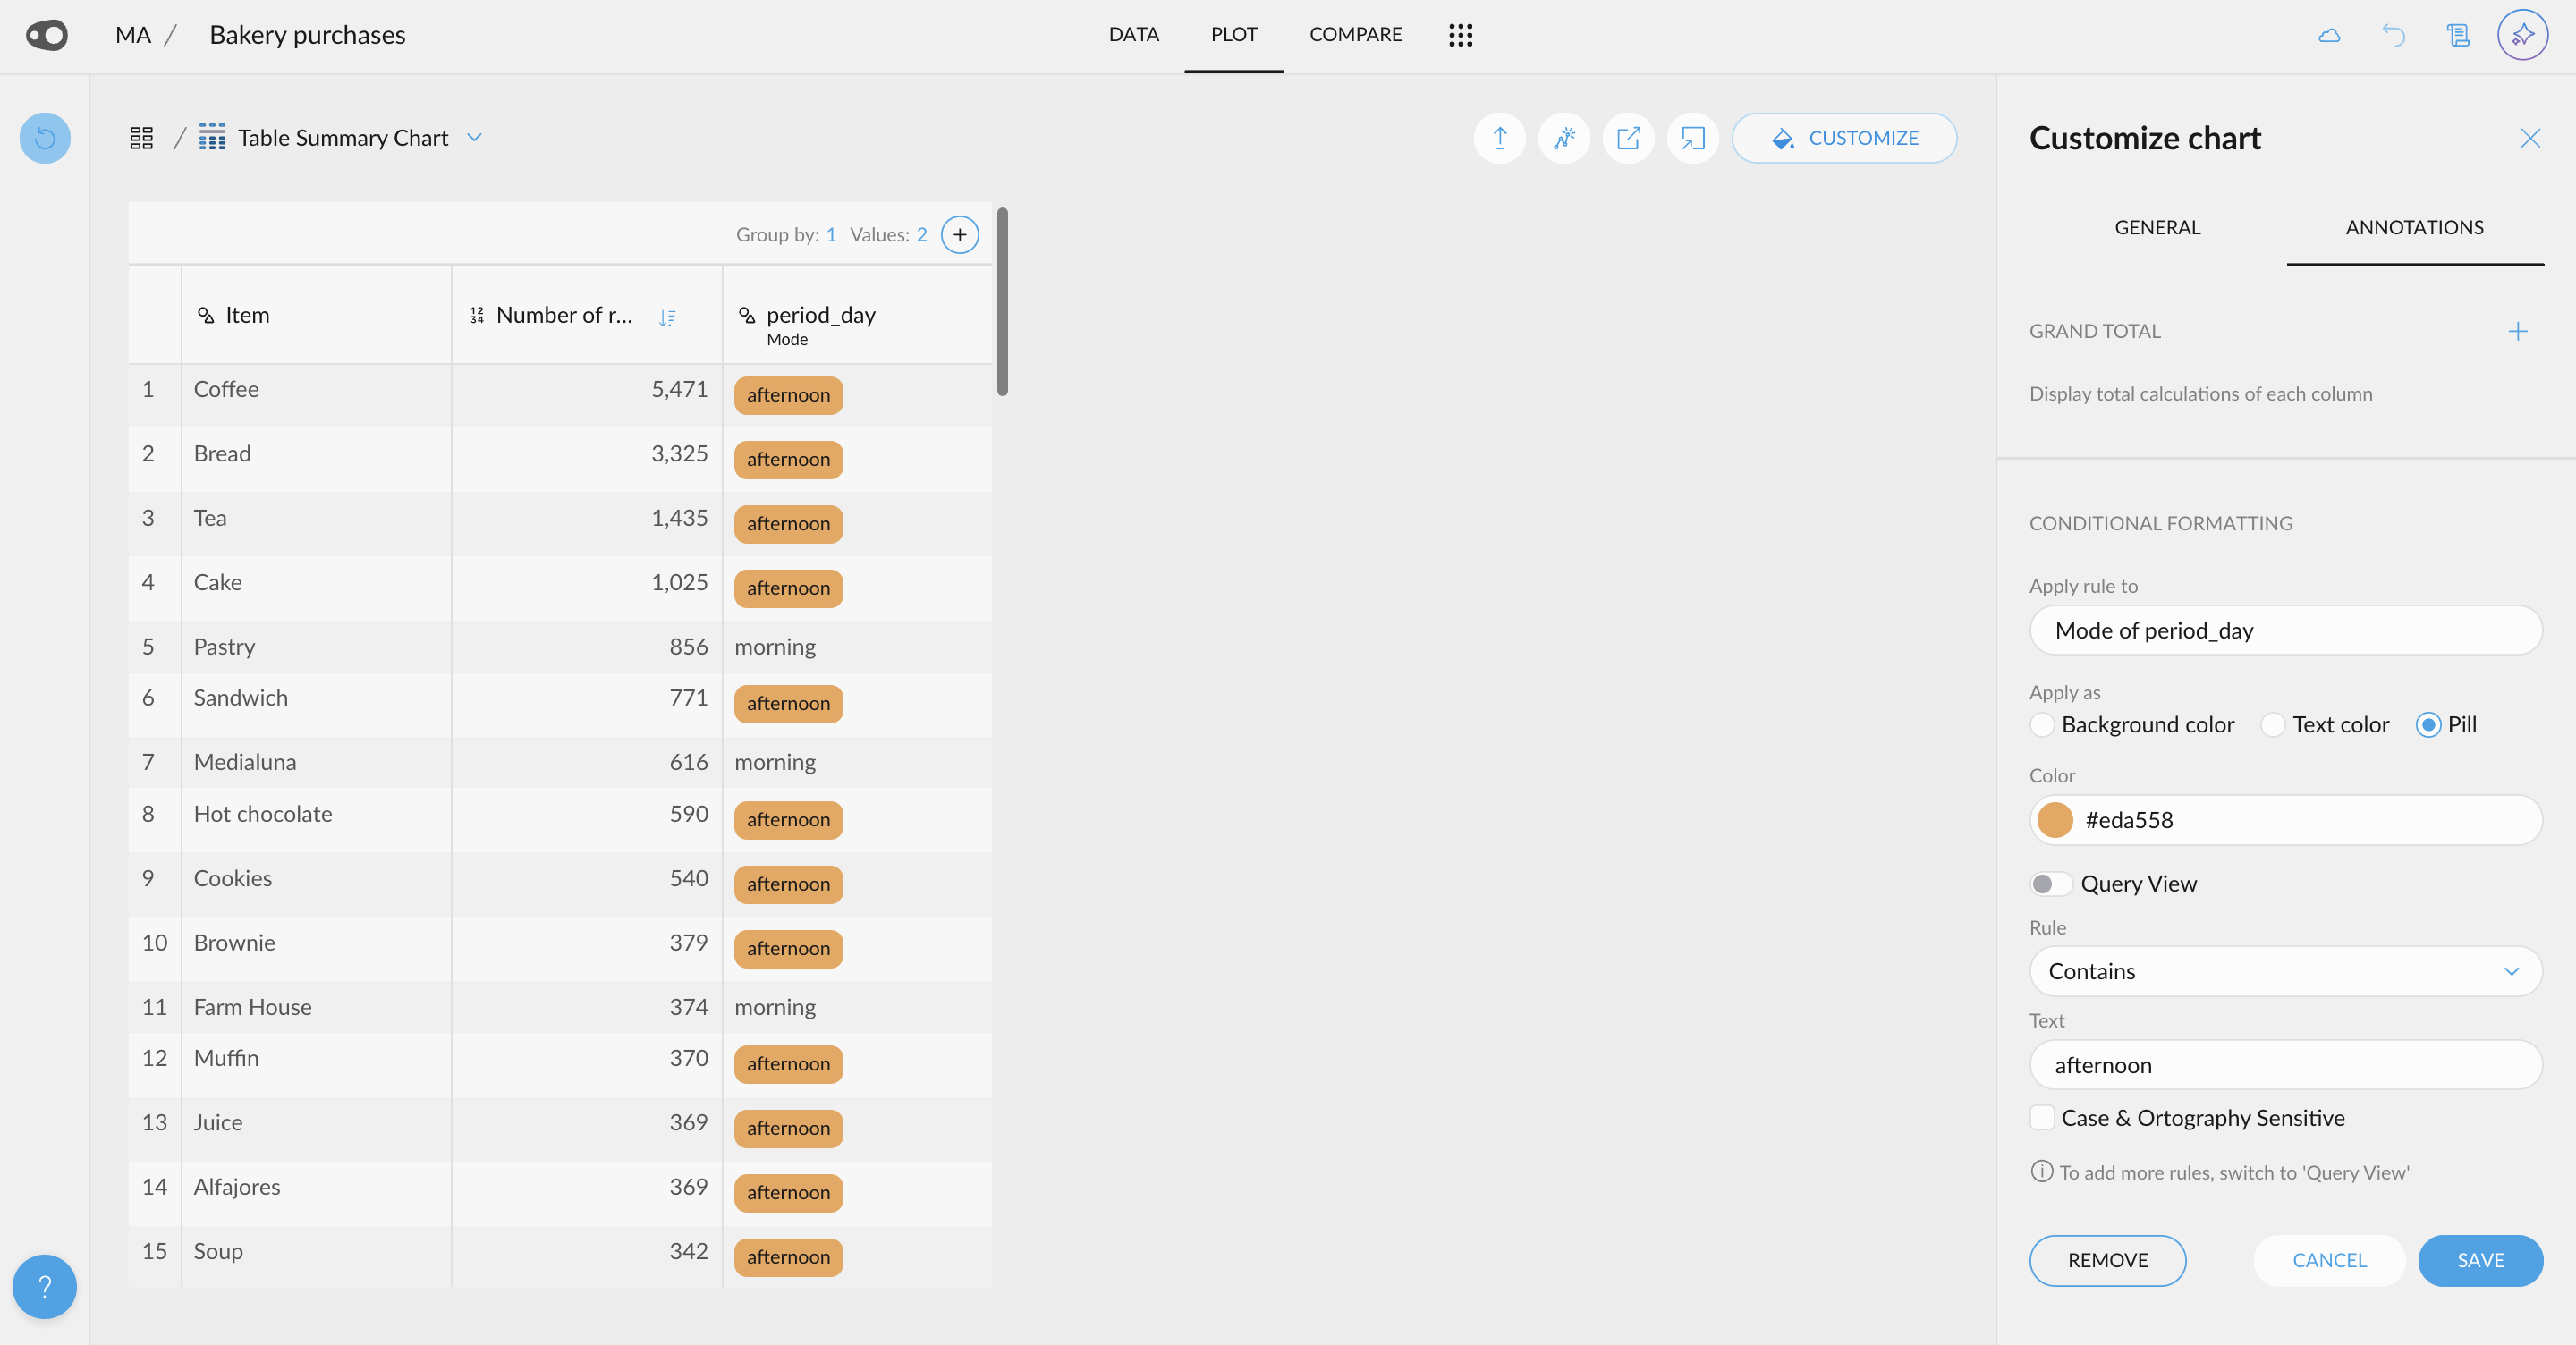
- New color summary design: We've improved the rule color summary for easier identification and refined the section titles. A clear, concise interface remains our top priority.

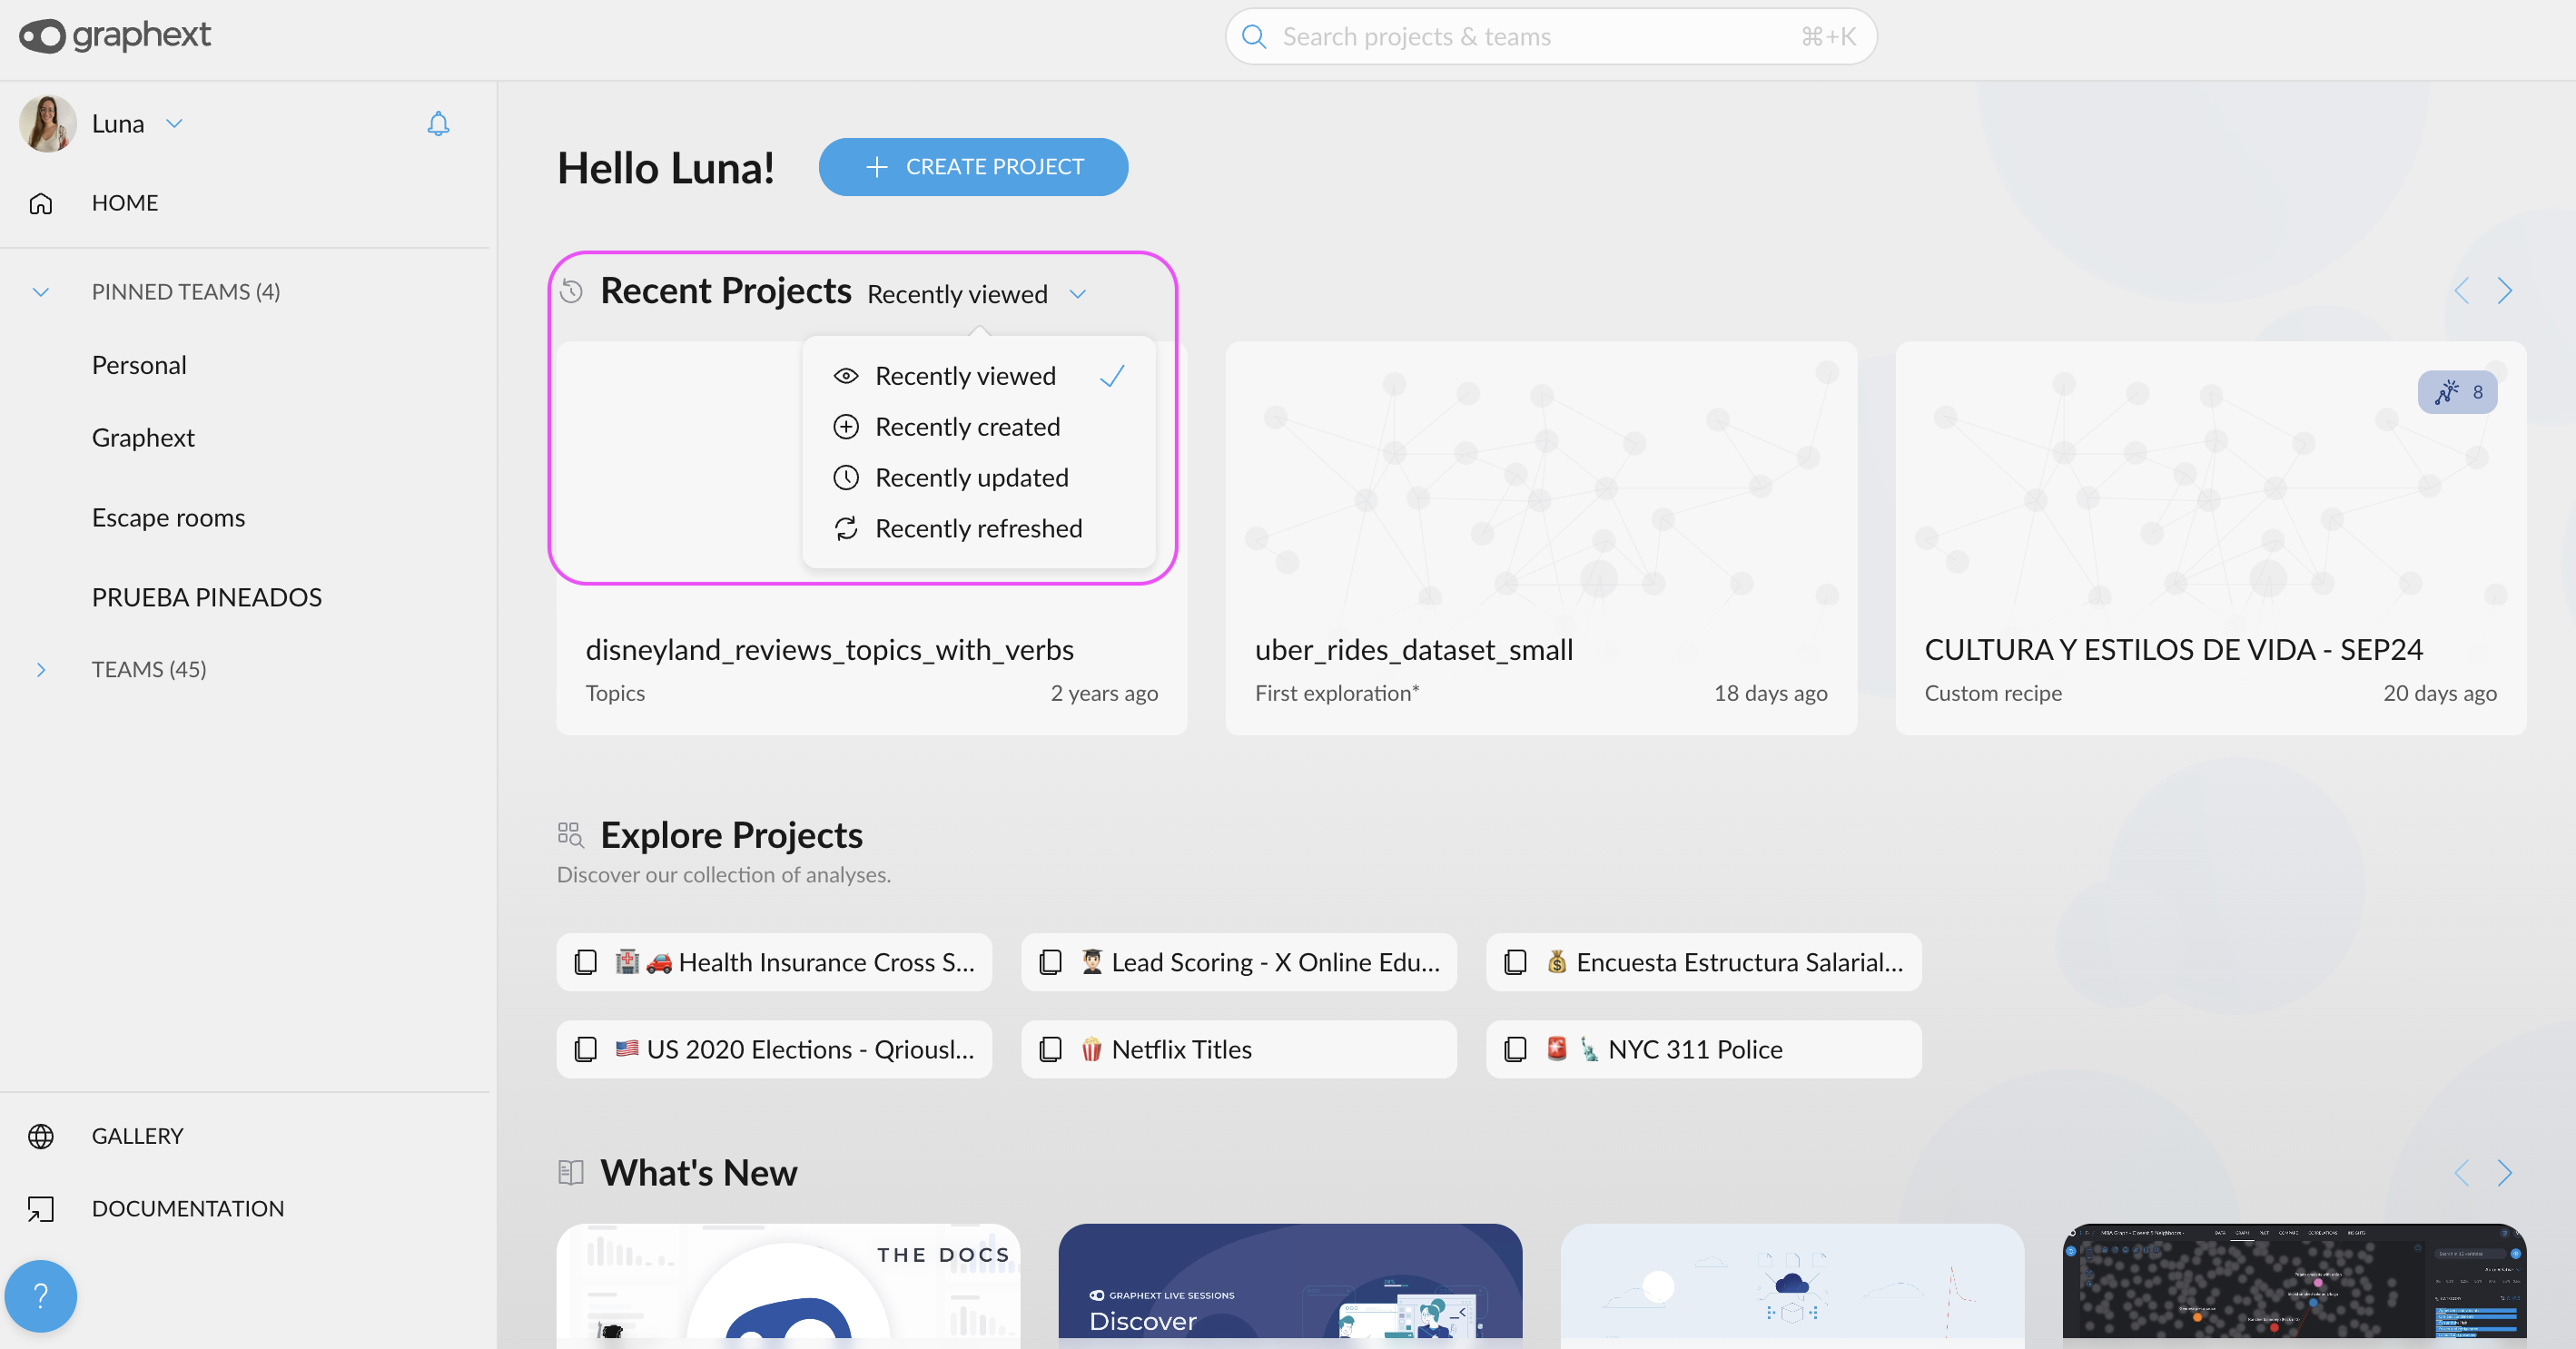
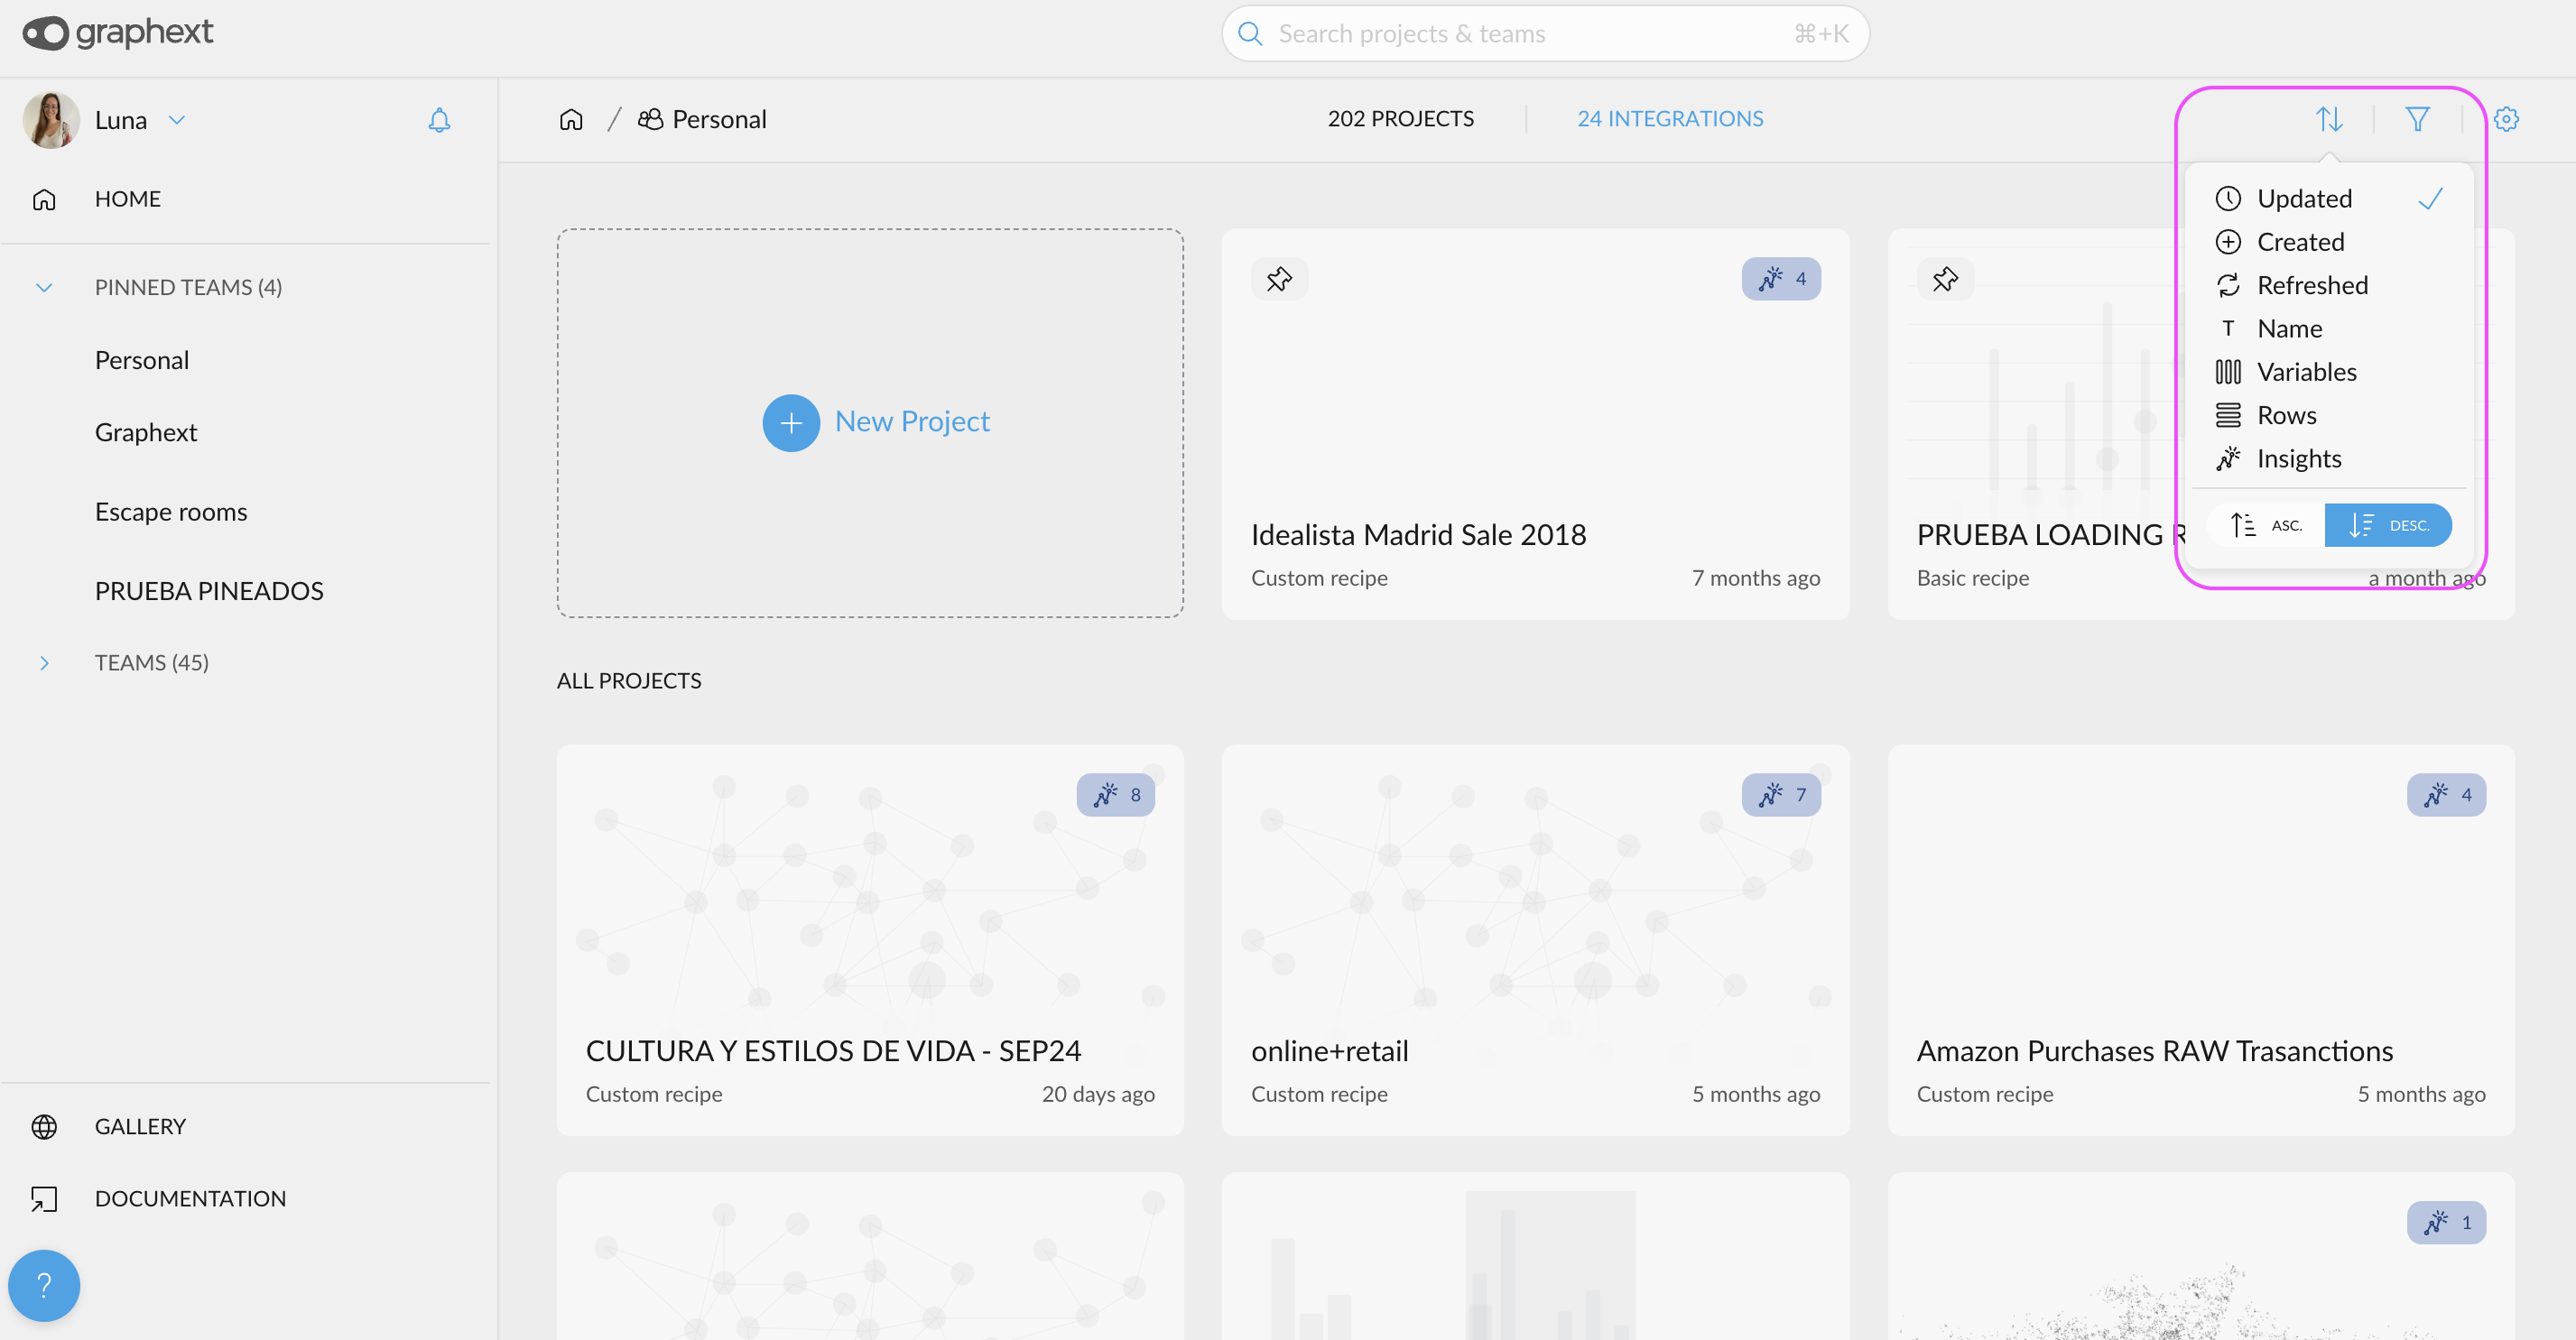
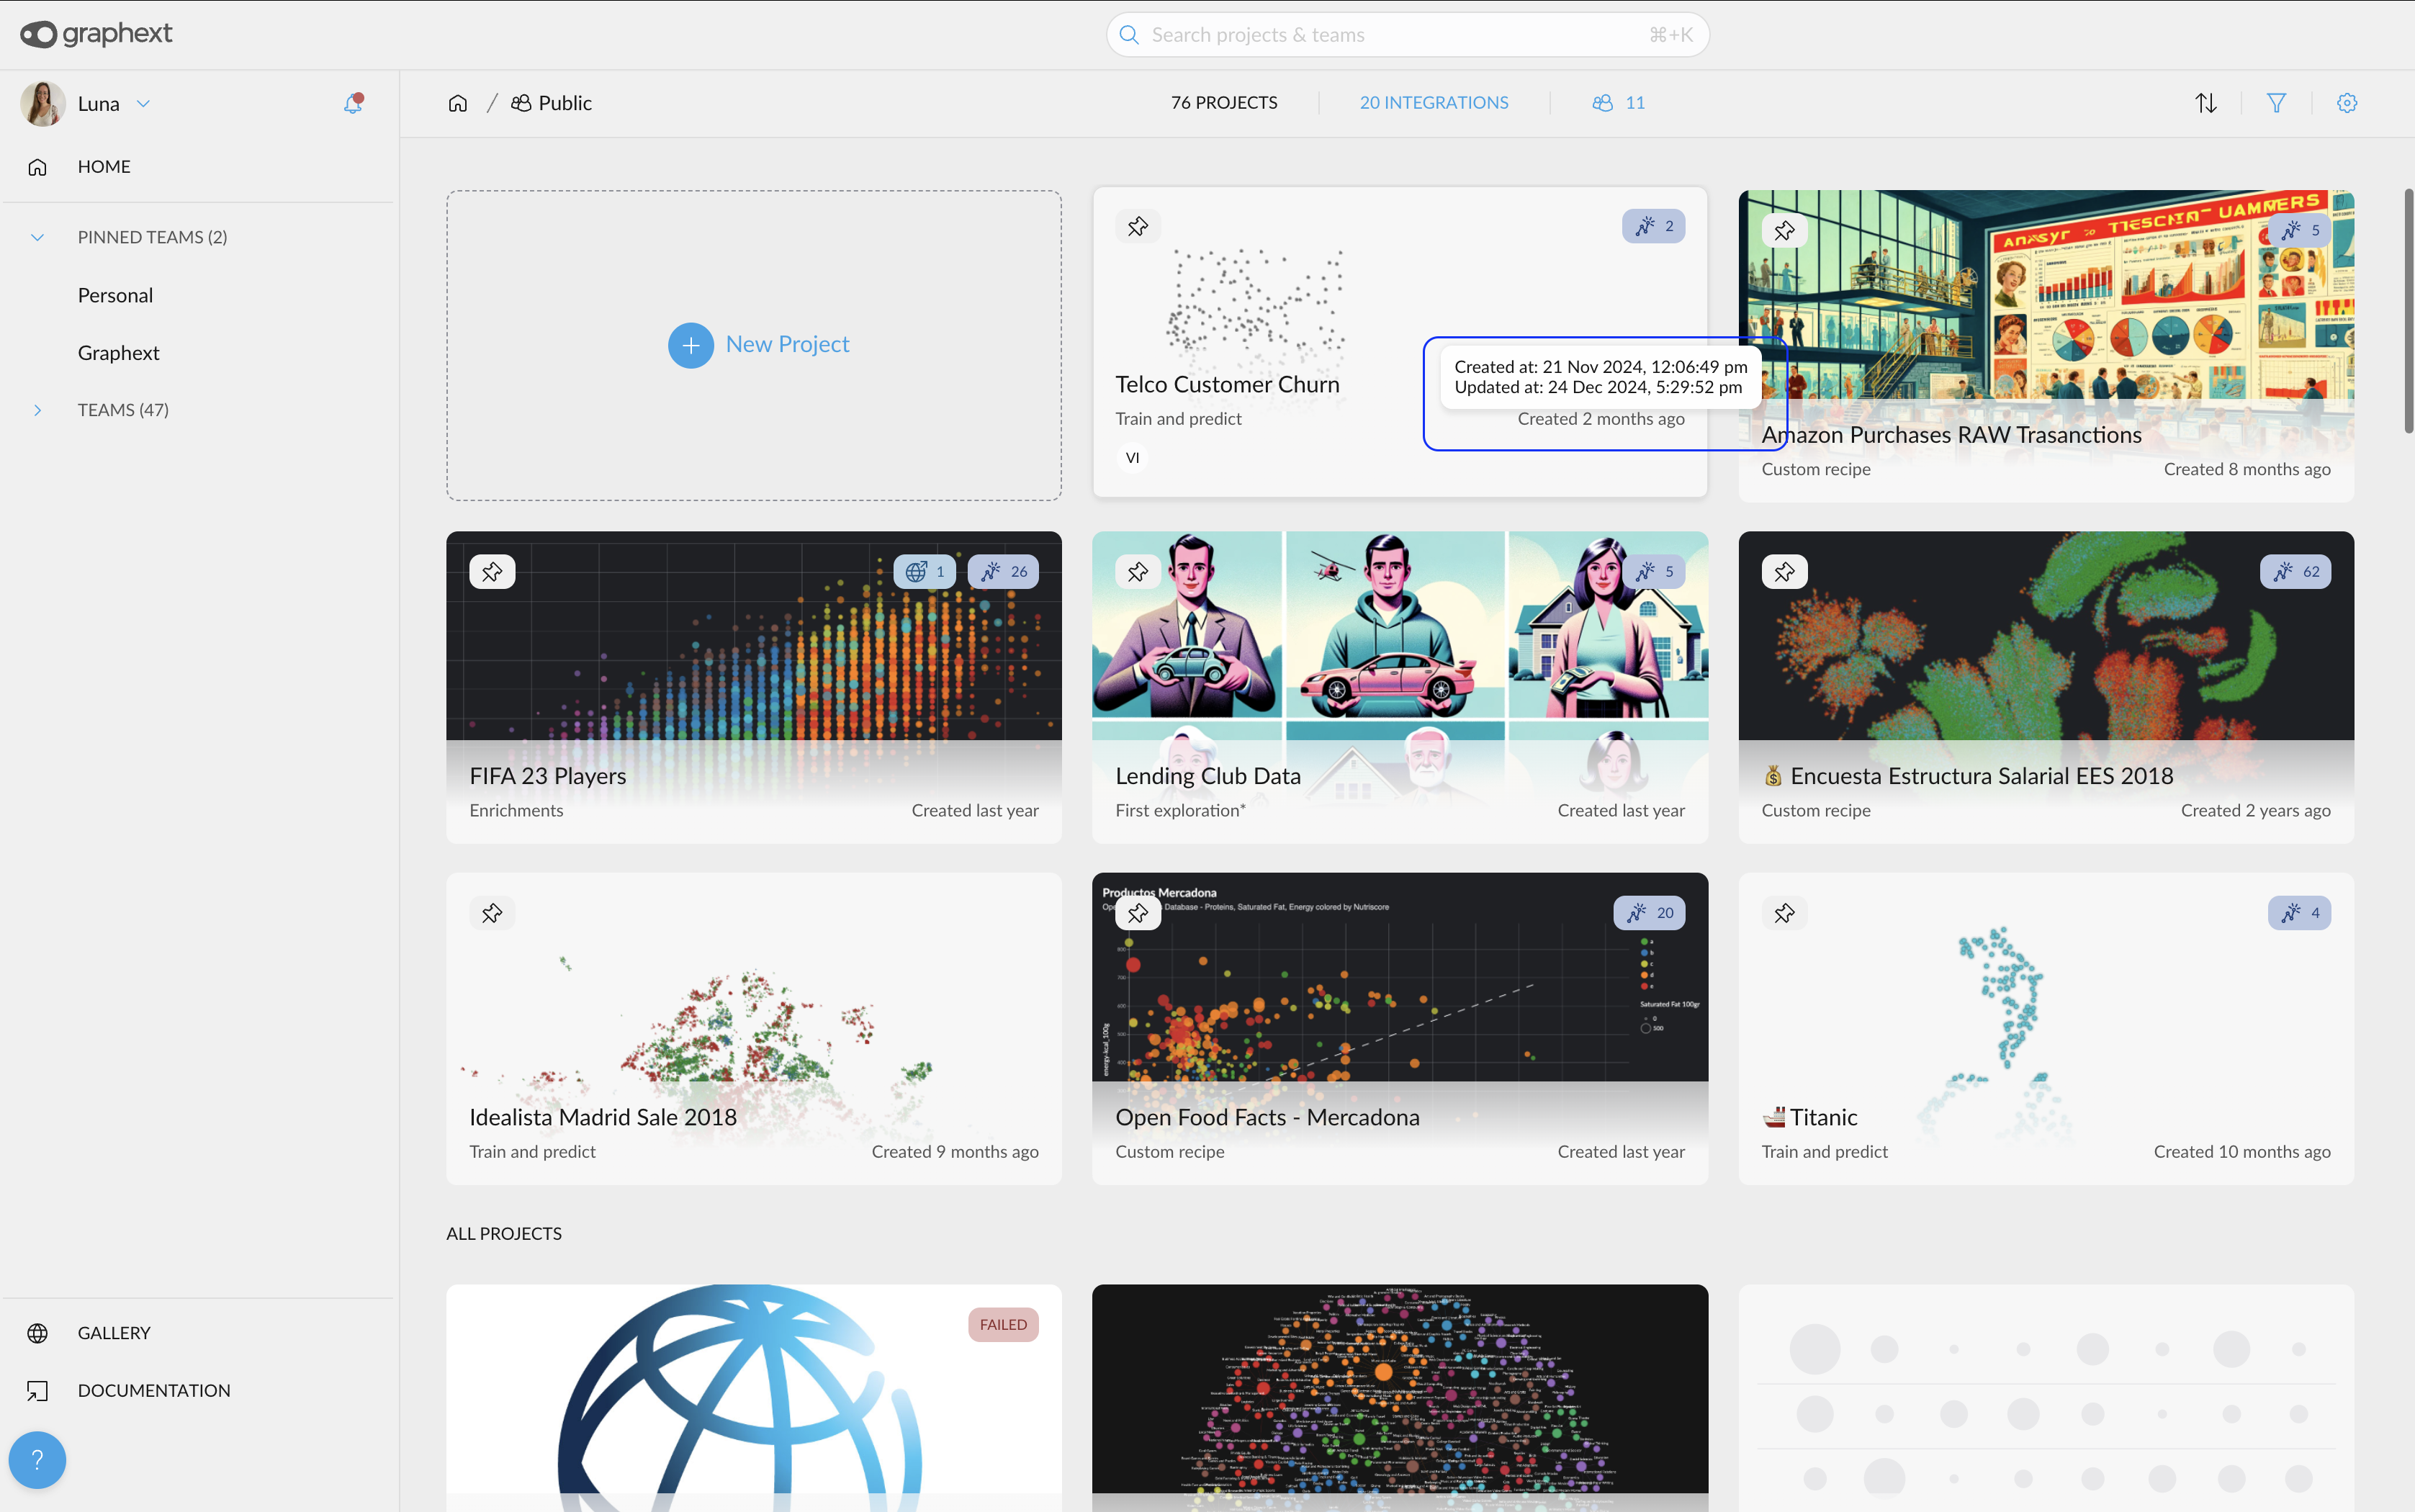
- We’ve clarified which date is displayed on the project card. Additionally, if you change the sorting criteria, the date shown will update to match the selected filter.
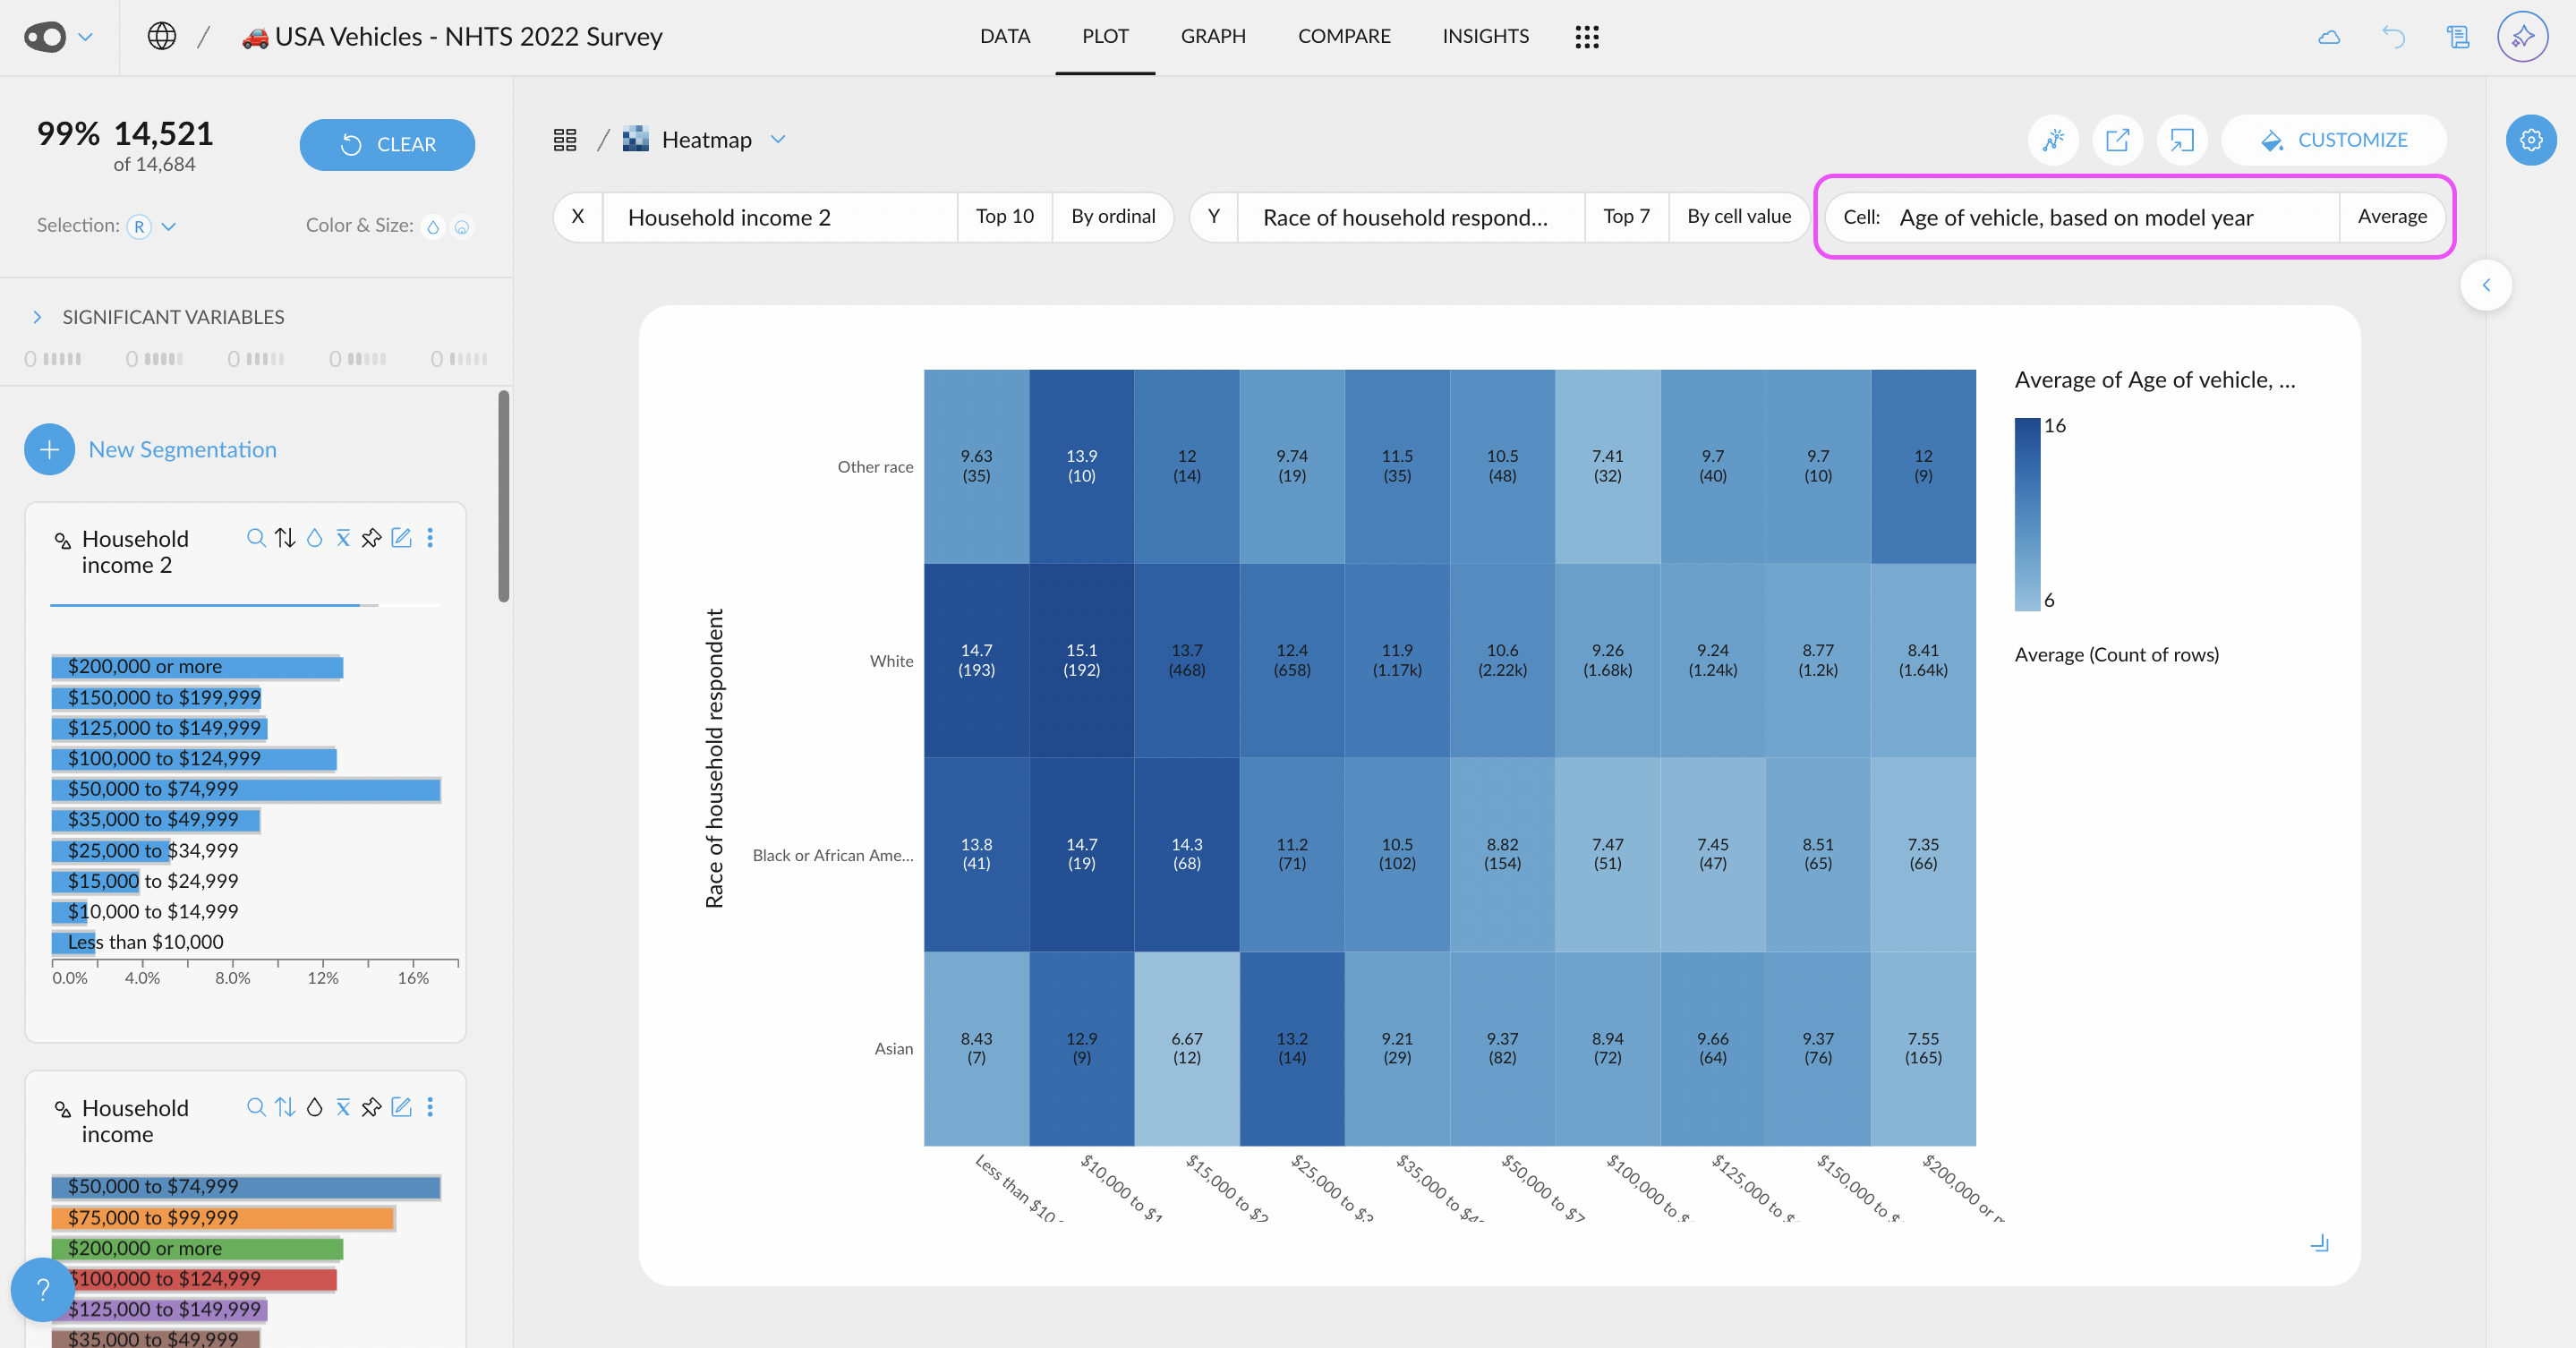
- You can now select variables hidden in the cross-filter directly from the plot distributor. These variables will be grouped at the bottom of the selector for easy access.

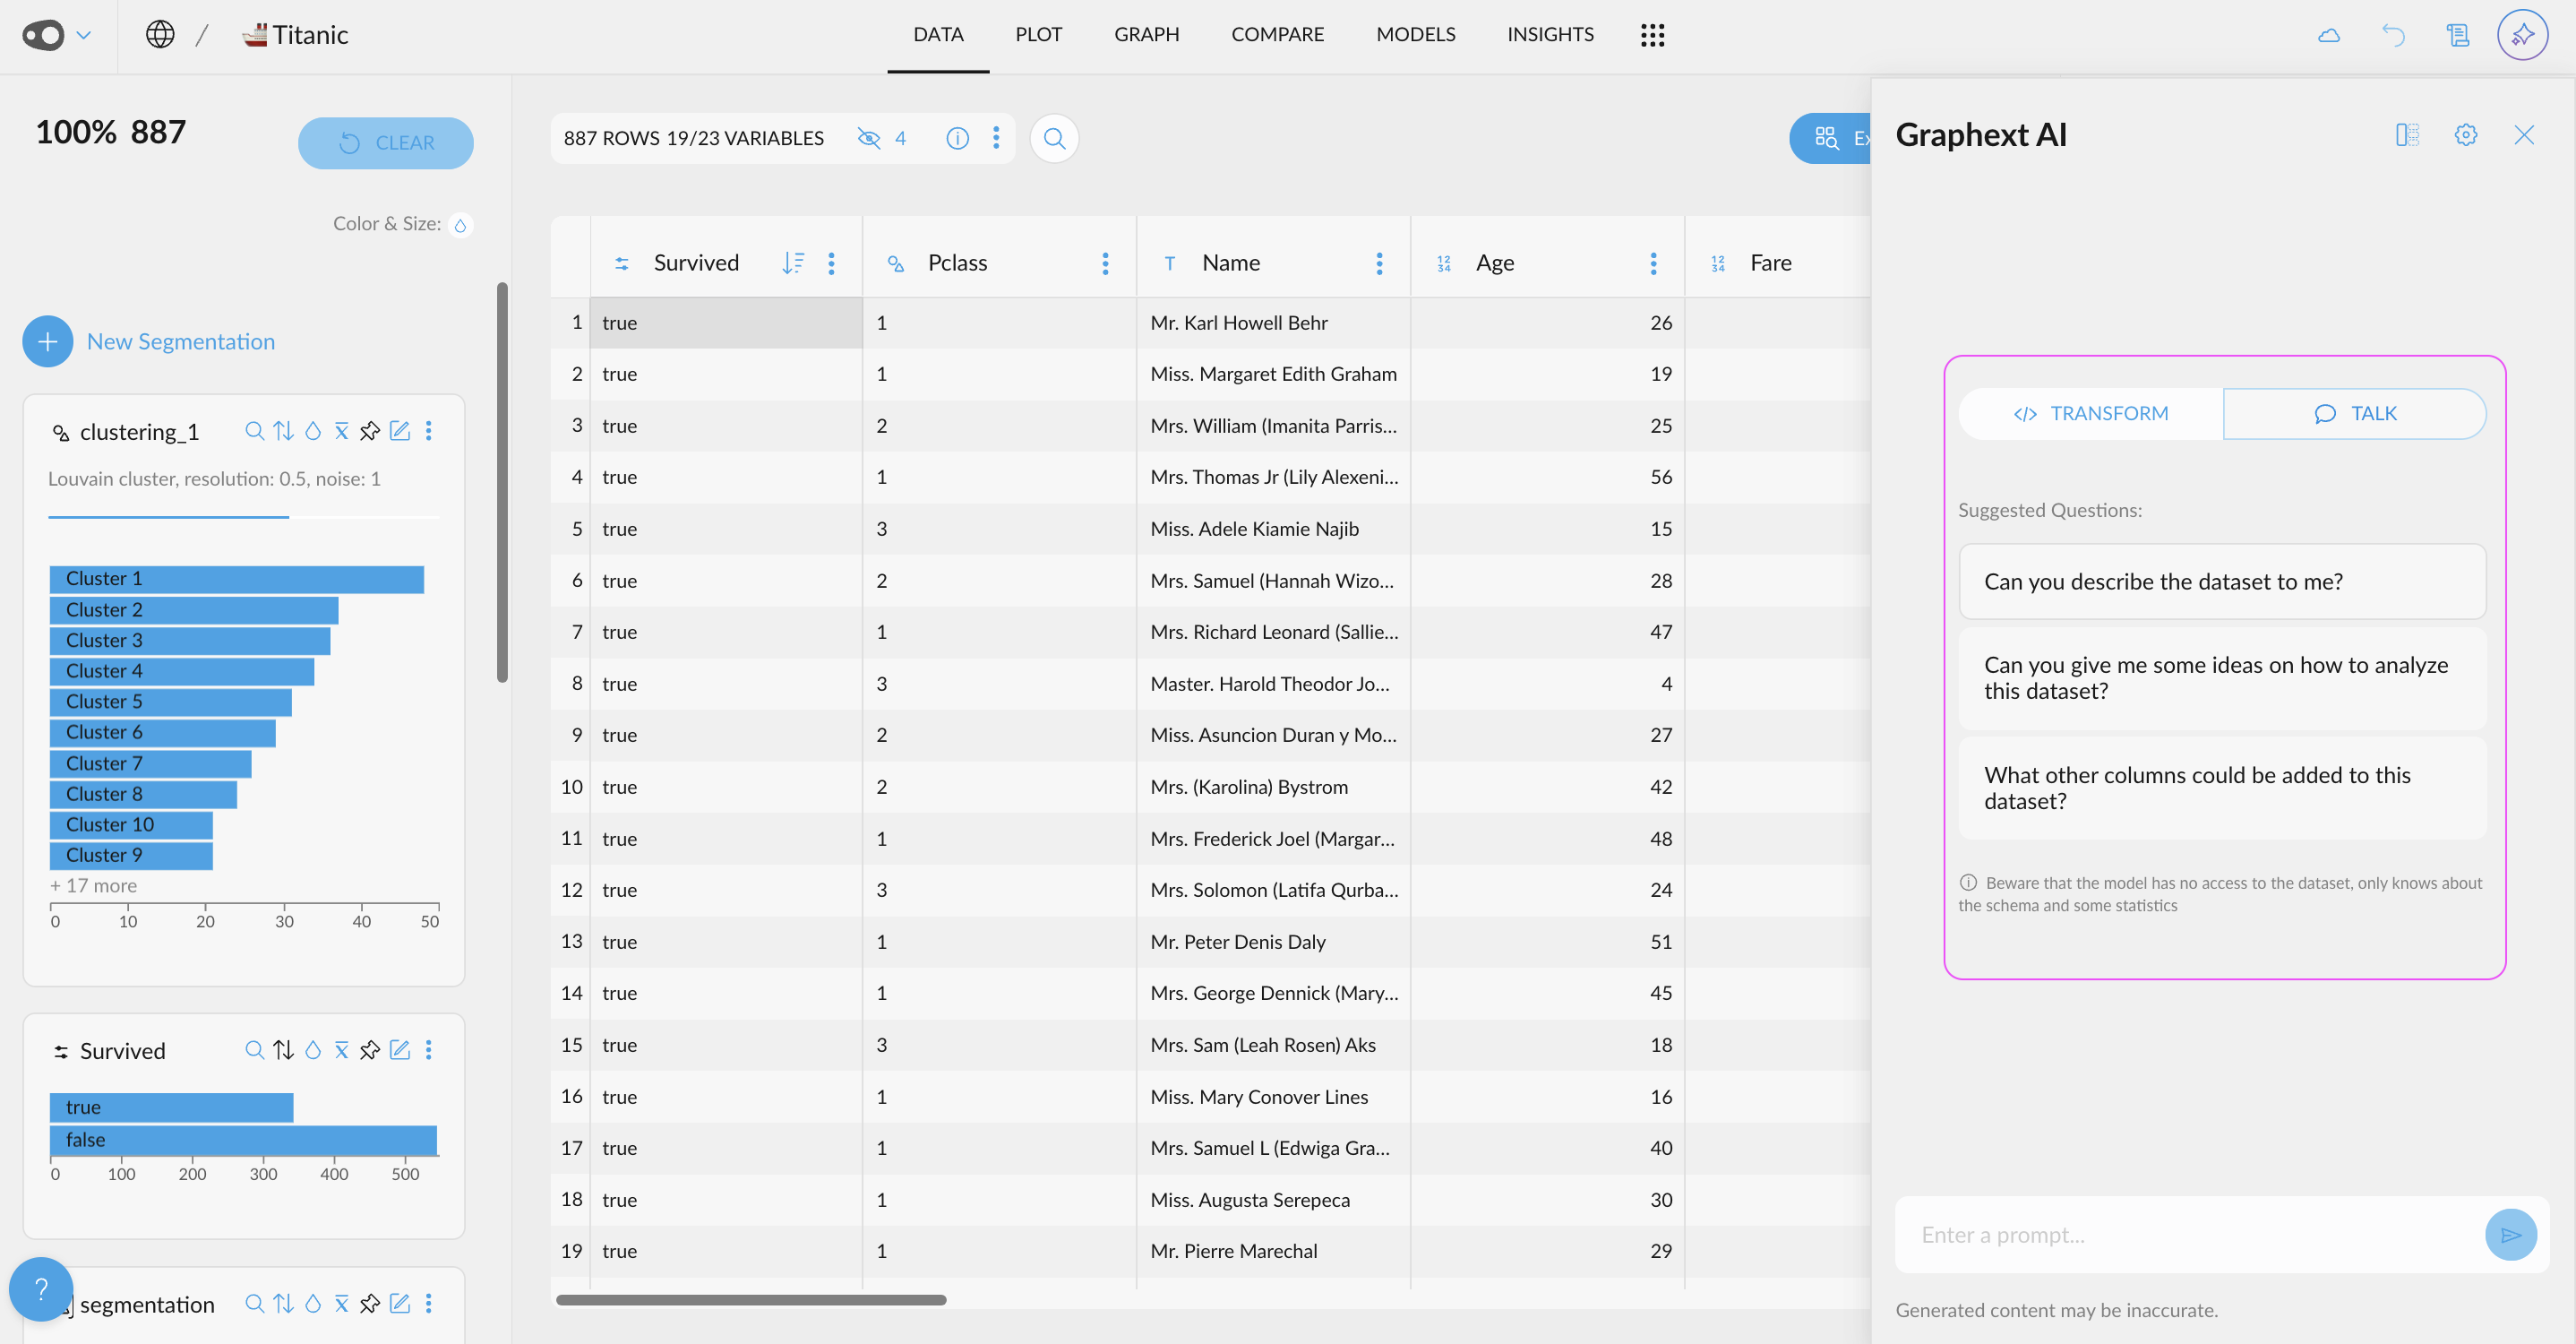
- Better error messages from Open AI API

🐛 Bug Fix
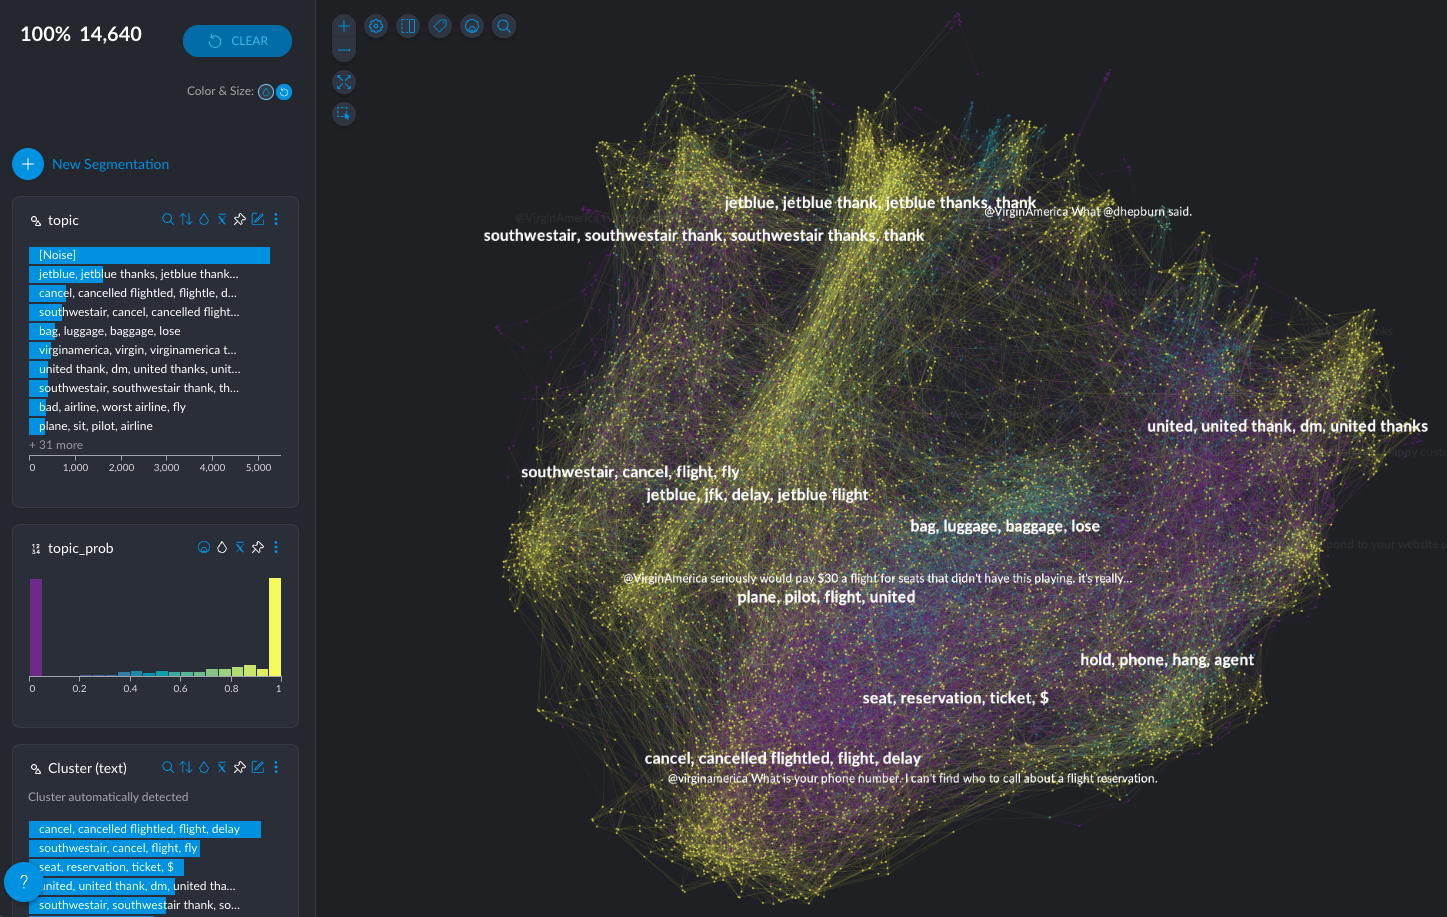
- You are now alerted and prevented from trying to apply dimensionality reduction to datasets having a single column only (in steps like embed_dataset, layout_dataset and cluster_dataset)
- SHAP explanations of model predictions now have correct JSON format. This means the corresponding column is now a valid input to steps like extract_json_values)